Thursday, March 20, 2008
Adjusting averages for not-outs, take three
This is my third attempt to implement a good method to deal with no-outs when calculating batting averages. The first two happened before this blog started (I've backdated one here), but both had flaws. The flaw in the one I just linked to is a subtle one, and I only realised it after reading this post by Charles Davis.
He was interested in calculating the average number of runs scored once you reach a century. This is basically the same question I have in projecting not-outs forward. If a batsman who averages 40 finishes 100 not out, how many extra runs would he have scored?
The way I did this originally was like this:
1. Take all innings greater than or equal to 100.
2. Take their average.
3. Subtract 100.
This seems reasonable, but Davis points out an anomaly. Suppose a batsman has scores of 100 not out, 100 not out, and 100. Then his average calculated by this method is 300 - 100 = 200. But he's never scored a run past 100. So what the procedure should be is:
1. Take all innings greater than or equal to 100.
2. Subtract 100 from each.
3. Take their average.
Now this example is extreme, but the problem is a significant one when you do this over all batsmen at all scores, because there are a lot of not-outs at each score. If you're interested, compare the graph below to the bad one in my earlier post.
For this graph, I took each batsman with a Test average of at least 40, and computed their average increases at each run (up to their highest score), and then took the average over all players at each score. If a batsman's highest score was a not-out, I added the batsman's average to it and turned it into an 'out'.
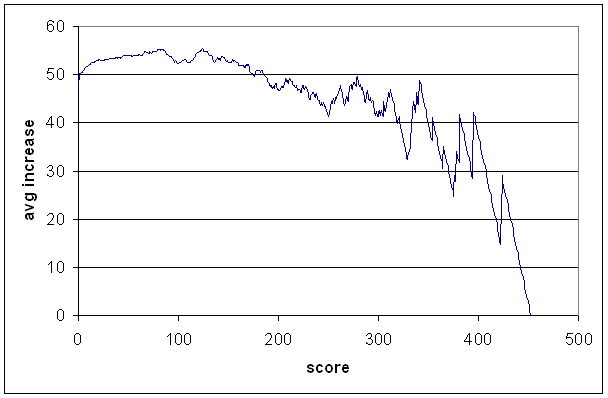
The average increase from zero (i.e., the overall average) is 47,5. The average increase from 1 is 49,8. So in a sense, your first run is worth three. This, along with the steady increase in the curve that you see until about 85, is just the effect of getting your eye in, and batting becoming easier as you continue to score runs.
The dip either side of 100 is what you might call a psychological feature — it's there because batsmen often drop their concentration once reaching a century and get out soon afterwards. The curve rises again until about 125, and then there's a pretty steady downward trend, with two more psychological dips around 200 and 250. There also looks to be one around 300, but there aren't many data points there.
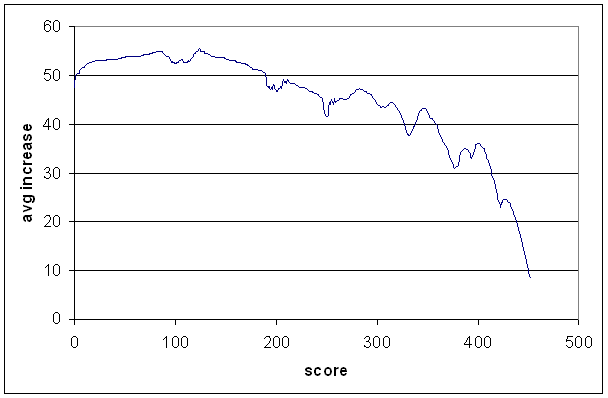
The curve has a lot of noise in it, and before using it to project not-outs forward, it's worth smoothing out the non-psychological bits. I didn't spend too much time doing this, and there are a couple of ugly splices, and in one place scoring a run actually sends you backwards by one run. That shouldn't be too serious in the grand scheme of things.
Now, you wouldn't want to just use this curve to project not-outs, because obviously some batsmen are better than others at making large scores. Steve Waugh v Mark Waugh is an obvious example. On the other hand, if you're projecting a not-out, and there's only one innings higher to work with, then that higher innings is probably not representative, and it's useful to use the overall average increase given in the graph.
Note that when using the graph on an individual batsman, I move it up or down so that the average increase from zero matches his average.
To compromise between just going by the individual and just going by the graph, I used the following formula, where n is the number of innings larger than the not-out to be projected:
proj = 1/sqrt(n+1) * proj_by_individual + (1 - 1/sqrt(n+1)) * proj_by_overall.
The co-efficients here are arbitrary, but I think they look OK. If there's one innings to work with, it gets about a 30% weight, and the graph gets 70% weight. If there are three innings, it's 50-50.
Now for some results. In the following table I've listed the top 20 batsmen as measured by this adjusted average. There's no adjustment for era or quality of bowling. The 'diff' is the difference between regular average and adjusted average. It's positive is the regular average is higher (i.e., inflated by not-outs), and negative if the regular average is lower (deflated by not-outs). The rank is the rank by regular average, which lets you see how the batsmen have shuffled around. Qualification 20 innings.
Overall there's not much change. Hammand and Sobers move up several places, but otherwise we're dealing with fairly small adjustments to the average.
Mike Hussey's adjustment is the largest of any batsman with an average over 40. That adjustment will likely come down as his career continues and his stats become more like those of other players.
Considering only batsmen who average over 40 with at least 50 innings, the average difference is -0,16. So on average, not-outs deflate averages by about a sixth of a run. There's a very slight (and noisy) trend saying that batsmen with a high proportion of not-outs have their averages deflated more, which also agrees with the idea that not-outs tend to deflate averages.
As I said, there's a lot of noise. In that latter dataset, there are 52 batsmen whose averages seem to be inflated by not-outs and 75 whose averages are deflated. But in almost all cases the differences are pretty small.
The moral of the story is not to worry about not-outs when looking at a batsman's stats.
One last comment. A paper by Clive Loader in 1996 considered Allan Border's career and the effects of not-outs on his average. It was only one example in the paper, which looked at something called censoring in various contexts. Using some kind of binomial model, he estimated that not-outs had deflated Border's average by between 1 or 2 runs. My numbers say that his average was inflated by about two fifths of a run. An unfortunate disagreement, and I probably won't get to the bottom of it without learning a good deal more statistics, because that paper uses methods beyond my current knowledge.
He was interested in calculating the average number of runs scored once you reach a century. This is basically the same question I have in projecting not-outs forward. If a batsman who averages 40 finishes 100 not out, how many extra runs would he have scored?
The way I did this originally was like this:
1. Take all innings greater than or equal to 100.
2. Take their average.
3. Subtract 100.
This seems reasonable, but Davis points out an anomaly. Suppose a batsman has scores of 100 not out, 100 not out, and 100. Then his average calculated by this method is 300 - 100 = 200. But he's never scored a run past 100. So what the procedure should be is:
1. Take all innings greater than or equal to 100.
2. Subtract 100 from each.
3. Take their average.
Now this example is extreme, but the problem is a significant one when you do this over all batsmen at all scores, because there are a lot of not-outs at each score. If you're interested, compare the graph below to the bad one in my earlier post.
For this graph, I took each batsman with a Test average of at least 40, and computed their average increases at each run (up to their highest score), and then took the average over all players at each score. If a batsman's highest score was a not-out, I added the batsman's average to it and turned it into an 'out'.
The average increase from zero (i.e., the overall average) is 47,5. The average increase from 1 is 49,8. So in a sense, your first run is worth three. This, along with the steady increase in the curve that you see until about 85, is just the effect of getting your eye in, and batting becoming easier as you continue to score runs.
The dip either side of 100 is what you might call a psychological feature — it's there because batsmen often drop their concentration once reaching a century and get out soon afterwards. The curve rises again until about 125, and then there's a pretty steady downward trend, with two more psychological dips around 200 and 250. There also looks to be one around 300, but there aren't many data points there.
The curve has a lot of noise in it, and before using it to project not-outs forward, it's worth smoothing out the non-psychological bits. I didn't spend too much time doing this, and there are a couple of ugly splices, and in one place scoring a run actually sends you backwards by one run. That shouldn't be too serious in the grand scheme of things.
Now, you wouldn't want to just use this curve to project not-outs, because obviously some batsmen are better than others at making large scores. Steve Waugh v Mark Waugh is an obvious example. On the other hand, if you're projecting a not-out, and there's only one innings higher to work with, then that higher innings is probably not representative, and it's useful to use the overall average increase given in the graph.
Note that when using the graph on an individual batsman, I move it up or down so that the average increase from zero matches his average.
To compromise between just going by the individual and just going by the graph, I used the following formula, where n is the number of innings larger than the not-out to be projected:
proj = 1/sqrt(n+1) * proj_by_individual + (1 - 1/sqrt(n+1)) * proj_by_overall.
The co-efficients here are arbitrary, but I think they look OK. If there's one innings to work with, it gets about a 30% weight, and the graph gets 70% weight. If there are three innings, it's 50-50.
Now for some results. In the following table I've listed the top 20 batsmen as measured by this adjusted average. There's no adjustment for era or quality of bowling. The 'diff' is the difference between regular average and adjusted average. It's positive is the regular average is higher (i.e., inflated by not-outs), and negative if the regular average is lower (deflated by not-outs). The rank is the rank by regular average, which lets you see how the batsmen have shuffled around. Qualification 20 innings.
name          inns  no  runs  avg    adj    diff   rank
DG Bradman    80    10  6996  99,94  99,38  +0,57  1
MEK Hussey    36    8   2188  78,14  74,25  +3,90  2
RG Pollock    41    4   2256  60,97  61,60  -0,63  3
GA Headley    40    4   2190  60,83  60,95  -0,12  4
WR Hammond    140   16  7249  58,46  60,04  -1,58  10
H Sutcliffe   84    9   4555  60,73  59,62  +1,11  5
GS Sobers     160   21  8032  57,78  59,02  -1,24  11
E Paynter     31    5   1540  59,23  58,80  +0,44  6
RT Ponting    191   26  9676  58,64  58,76  -0,11  8
ED Weekes     81    5   4455  58,62  58,49  +0,13  9
KF Barrington 131   15  6806  58,67  57,83  +0,84  7
KC Sangakkara 114   10  5914  56,87  57,18  -0,32  14
SR Tendulkar  236   26  11851 56,43  57,06  -0,63  18
L Hutton      138   15  6971  56,68  57,06  -0,38  16
JH Kallis     195   32  9394  57,63  56,78  +0,85  12
CL Walcott    74    7   3798  56,69  56,53  +0,16  15
JB Hobbs      102   7   5410  56,95  56,51  +0,43  13
RS Dravid     202   25  10015 56,58  56,45  +0,13  17
Mohd Yousuf   138   12  7009  55,63  55,59  +0,04  19
VG Kambli     21    1   1084  54,20  54,55  -0,35  22
Overall there's not much change. Hammand and Sobers move up several places, but otherwise we're dealing with fairly small adjustments to the average.
Mike Hussey's adjustment is the largest of any batsman with an average over 40. That adjustment will likely come down as his career continues and his stats become more like those of other players.
Considering only batsmen who average over 40 with at least 50 innings, the average difference is -0,16. So on average, not-outs deflate averages by about a sixth of a run. There's a very slight (and noisy) trend saying that batsmen with a high proportion of not-outs have their averages deflated more, which also agrees with the idea that not-outs tend to deflate averages.
As I said, there's a lot of noise. In that latter dataset, there are 52 batsmen whose averages seem to be inflated by not-outs and 75 whose averages are deflated. But in almost all cases the differences are pretty small.
The moral of the story is not to worry about not-outs when looking at a batsman's stats.
One last comment. A paper by Clive Loader in 1996 considered Allan Border's career and the effects of not-outs on his average. It was only one example in the paper, which looked at something called censoring in various contexts. Using some kind of binomial model, he estimated that not-outs had deflated Border's average by between 1 or 2 runs. My numbers say that his average was inflated by about two fifths of a run. An unfortunate disagreement, and I probably won't get to the bottom of it without learning a good deal more statistics, because that paper uses methods beyond my current knowledge.
# posted by David Barry : 10:32

Comments:
<< Home
Interesting analysis, which brings another question to my mind. Don't know if you have/would ever consider it, and it is obviously much harder to do, but what about one day averages? Some people consider Michael Bevan, for example to have an average that was almost ludicrously inflated by the large number not outs he had as a finisher. How would his/other top 1day batsmens averages fair under this system? I've seen a few other 1day average adjustments for different reasons (the economist, for example, did one), and some of the averages changed wildly when they adjusted it, but in vastly different ways depending how they did it.

I don't have an ODI database, so I couldn't say for sure what would happen there. My suspicion is that averages wouldn't change much, but there would be different factors at play - those in the middle to lower order would (presumably) tend to get out slogging at the death fairly often, so a 20 not out might only become (on average) a 35, rather than a 55. This would mean that ODI averages are often inflated by not-outs, but I don't know.
Bevan is an interesting case, because he is somewhat of a natural experiment on this topic. At number four, he had 15 not-outs in 53 innings (28%) and an average of 59.6. At number six, he had 34 not-outs in 87 innings (39%) and averaged 56.7. So his average went up when he had less not-outs.
To be fair, that's not the whole story. In between at number five: 5 not-outs in 33 innings (15%), average of 41.6. I would interpret this as a biased sample of Bevan's batting though, rather than evidence for not-outs inflating averages.
Overall I don't think that Bevan's average is inflated much, if at all.
Post a Comment
Bevan is an interesting case, because he is somewhat of a natural experiment on this topic. At number four, he had 15 not-outs in 53 innings (28%) and an average of 59.6. At number six, he had 34 not-outs in 87 innings (39%) and averaged 56.7. So his average went up when he had less not-outs.
To be fair, that's not the whole story. In between at number five: 5 not-outs in 33 innings (15%), average of 41.6. I would interpret this as a biased sample of Bevan's batting though, rather than evidence for not-outs inflating averages.
Overall I don't think that Bevan's average is inflated much, if at all.
Subscribe to Post Comments [Atom]
<< Home
![]()
Subscribe to Posts [Atom]