Saturday, November 10, 2007
Not outs and batting averages
Edit: This analysis is bad, for reasons explained here.
In this entry I give some methods of adjusting the batting average, taking account of not outs in a better way than the usual average.
The main question considered here is, "When a batsman is left not out, how many more runs would he have scored, if he had been able to complete his innings?" As usual, credit to Charles Davis for making me think of this question.
1. For each batsman with an average over 40, scale his innings so that his average becomes 40.
2. Put all of these batsmen's scaled innings in a big heap, paying attention to which are outs and which not outs.
3. For each integer x between zero and the highest score made (after the scaling, it turned out to be 337), calculate the extra runs a batsman would be expected to score, given that he was x not out. The number of extra runs is simply the average of all innings of at least x runs (ie, total runs divided by number of dismissals).
4. Plot a graph of expected extra runs against not out score.
Here is the graph. The blue curve is the raw data, and the black lines are linear fits, the first from x = 10 to 100, the second from x = 100 to 250 (I forced the second line to intersect with the first at x = 100). The linearity of the section between 10 and 100 runs is extraordinary - I was stunned. Of all possible relationships, it's almost perfectly linear.
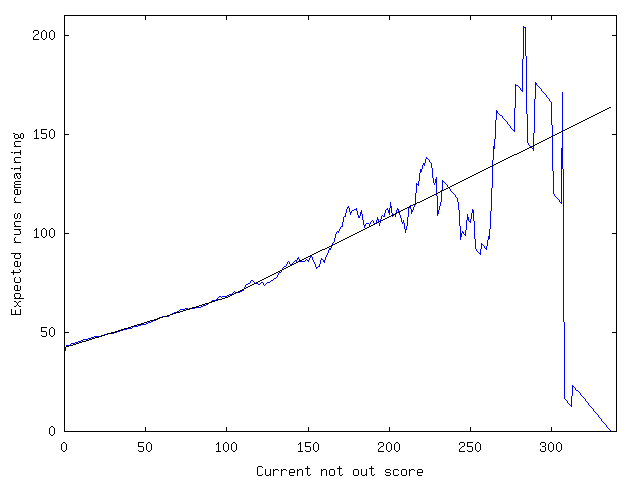
It's difficult to see, but there's a sharp rise between x = 0 and x = 1. Getting your first run gives you more than a three-run boost.
The gradient of the linear section, if you're wondering, is about 0.25. So for every 4 runs you score, the expectation of your total innings score goes up by 5.
One way of modifying the batting average is now clear. First scale the batsman's innings so that he averages 40. For each not out, read off the extra runs he is expected to score, and add them to the not out. Un-scale his innings, and find his new average. I'll call this the regression method (Reg in the table below).
This method, however, assumes uniformity in the distribution of scores for each batsman, and we all know that to be false. Steve Waugh made lots of big hundreds, and Mark never got to 160. So at the other extreme, we have another scheme: for each batsman's not outs, take the average of his other innings greater than or equal to that score, and replace the not out with this number. I'll call this the individual method (Indiv).
I think that there's a problem with this, though, especially for batsmen with a small number of large scores. Some large scores are outliers, and it happens sometimes that a batsman's first big score is an outlier. If you just use the individual's innings to modify the average, you might be giving undue weight to outliers.
So I compromised. Suppose that a batsman has n scores greater than or equal to one of his not outs (not including the not out). I gave a weighting of 1/sqrt(n+1) to the regression method, and (1 - 1/sqrt(n+1)) to the individual method. This was pretty arbitrary. This is the compromise method (Comp).
I let these algorithms loose on all batsmen. Firstly, I'll give some examples, so we can all see what sort of results this gives. I hope this displays properly - I've been bad and lazy and used tabs.
One thing is clear from these examples - some batsmen do significantly better under the regression method than the individual method, and vice versa. We can interpret this by saying that those batsmen with high Indiv averages do a better job at making big scores than the average, and those with higher Reg averages are worse than average. The comparison of the Waugh brothers gives us a sanity check, as it agrees with what we know from real life.
So, we can use the difference between Reg and Indiv averages as a measure of how good or bad a batsman is at making big scores. I filtered for batsmen who'd scored at least 1001 runs. Those with the highest values of (Indiv - Reg) are:
Ridley Jacobs certainly surprised me! The reason why he does so well in the Indiv is because three of his centuries were not outs. I'm sure you can all guess what's going on with Gillespie. Adams' extraordinarily high figure is explained when you look at his centuries: 137, 125*, 174*, 151, 208*, 101*. When he made a big score, he hardly ever got out.
At the other end of the table, we get the following.
Bradman's and Hussey's presence is easily explained - the regression was done almost exlusively on players who averaged between 40 and 60, and it's unreasonable to expect that the same distribution of scores would hold for batsmen with much higher averages.
Joe Hardstaff (Jr) is there because of a bug/feature in the algorithm. If a player's highest score was a not out, then for the purposes of the Indiv calculation, I treated it as out. (For the compromise calculation, I just used the regression value.) Hardstaff had only three not outs, and two of these were his highest two scores. So he suffers because of an algorithmic short-cut of mine, not because of something inherent in his play.
Similar reasoning applies to Mead and Ryder. George Headley's is a bit different - I think he's more like Hussey and Bradman in this table.
Perhaps this (Indiv - Reg) isn't such a great measure as it stands. It does all right though, for a first try.
Anyway, I think the compromise measure does a reasonable job of adjusting the batting average for not outs. Here are the highest Comp averages:
As usual, feel free to request any other players.
And for those of you wondering why Andy Flower's compromise score is greater than both his regression and individual scores... I will work it out later if you don't beat me to it. It might be like when someone moves from country A to country B and raises the average IQ of both countries.
In this entry I give some methods of adjusting the batting average, taking account of not outs in a better way than the usual average.
The main question considered here is, "When a batsman is left not out, how many more runs would he have scored, if he had been able to complete his innings?" As usual, credit to Charles Davis for making me think of this question.
1. For each batsman with an average over 40, scale his innings so that his average becomes 40.
2. Put all of these batsmen's scaled innings in a big heap, paying attention to which are outs and which not outs.
3. For each integer x between zero and the highest score made (after the scaling, it turned out to be 337), calculate the extra runs a batsman would be expected to score, given that he was x not out. The number of extra runs is simply the average of all innings of at least x runs (ie, total runs divided by number of dismissals).
4. Plot a graph of expected extra runs against not out score.
Here is the graph. The blue curve is the raw data, and the black lines are linear fits, the first from x = 10 to 100, the second from x = 100 to 250 (I forced the second line to intersect with the first at x = 100). The linearity of the section between 10 and 100 runs is extraordinary - I was stunned. Of all possible relationships, it's almost perfectly linear.
It's difficult to see, but there's a sharp rise between x = 0 and x = 1. Getting your first run gives you more than a three-run boost.
The gradient of the linear section, if you're wondering, is about 0.25. So for every 4 runs you score, the expectation of your total innings score goes up by 5.
One way of modifying the batting average is now clear. First scale the batsman's innings so that he averages 40. For each not out, read off the extra runs he is expected to score, and add them to the not out. Un-scale his innings, and find his new average. I'll call this the regression method (Reg in the table below).
This method, however, assumes uniformity in the distribution of scores for each batsman, and we all know that to be false. Steve Waugh made lots of big hundreds, and Mark never got to 160. So at the other extreme, we have another scheme: for each batsman's not outs, take the average of his other innings greater than or equal to that score, and replace the not out with this number. I'll call this the individual method (Indiv).
I think that there's a problem with this, though, especially for batsmen with a small number of large scores. Some large scores are outliers, and it happens sometimes that a batsman's first big score is an outlier. If you just use the individual's innings to modify the average, you might be giving undue weight to outliers.
So I compromised. Suppose that a batsman has n scores greater than or equal to one of his not outs (not including the not out). I gave a weighting of 1/sqrt(n+1) to the regression method, and (1 - 1/sqrt(n+1)) to the individual method. This was pretty arbitrary. This is the compromise method (Comp).
I let these algorithms loose on all batsmen. Firstly, I'll give some examples, so we can all see what sort of results this gives. I hope this displays properly - I've been bad and lazy and used tabs.
Name        Usual Reg   Comp  Indiv

M.Waugh     41,82 43,42 42,95 41,81
S.Waugh     51,06 56,19 60,95 61,86
G.Chappell  53,86 57,48 57,17 54,25
A.Flower    51,55 57,06 60,41 58,19
One thing is clear from these examples - some batsmen do significantly better under the regression method than the individual method, and vice versa. We can interpret this by saying that those batsmen with high Indiv averages do a better job at making big scores than the average, and those with higher Reg averages are worse than average. The comparison of the Waugh brothers gives us a sanity check, as it agrees with what we know from real life.
So, we can use the difference between Reg and Indiv averages as a measure of how good or bad a batsman is at making big scores. I filtered for batsmen who'd scored at least 1001 runs. Those with the highest values of (Indiv - Reg) are:
Name          Usual Reg   Indiv I-R

R.Jacobs      28,32 30,22 43,46 13,24
J.Gillespie   18,74 19,94 30,02 10,08
J.Adams       41,26 45,61 55,63 10,02
S.Chanderpaul 46,64 50,53 57,11 6,58
S.Pollock     32,32 34,67 40,64 5,97
S.Waugh       51,06 56,19 61,86 5,67
Ridley Jacobs certainly surprised me! The reason why he does so well in the Indiv is because three of his centuries were not outs. I'm sure you can all guess what's going on with Gillespie. Adams' extraordinarily high figure is explained when you look at his centuries: 137, 125*, 174*, 151, 208*, 101*. When he made a big score, he hardly ever got out.
At the other end of the table, we get the following.
Name        Usual Reg     Indiv   I-R

D.Bradman   99,94 111,28  101,18  -10,1
J.Hardstaff 46,74 50,73   40,06   -10,67
J.Ryder     51,63 56,6    45,52   -11,08
P.Mead      49,38 52,43   40,89   -11,54
G.Headley   60,83 67,9    56,16   -11,74
M.Hussey    79,85 88      75,75   -12,25
Bradman's and Hussey's presence is easily explained - the regression was done almost exlusively on players who averaged between 40 and 60, and it's unreasonable to expect that the same distribution of scores would hold for batsmen with much higher averages.
Joe Hardstaff (Jr) is there because of a bug/feature in the algorithm. If a player's highest score was a not out, then for the purposes of the Indiv calculation, I treated it as out. (For the compromise calculation, I just used the regression value.) Hardstaff had only three not outs, and two of these were his highest two scores. So he suffers because of an algorithmic short-cut of mine, not because of something inherent in his play.
Similar reasoning applies to Mead and Ryder. George Headley's is a bit different - I think he's more like Hussey and Bradman in this table.
Perhaps this (Indiv - Reg) isn't such a great measure as it stands. It does all right though, for a first try.
Anyway, I think the compromise measure does a reasonable job of adjusting the batting average for not outs. Here are the highest Comp averages:
Name      Usual   Comp

D.Bradman 99,94   104,8
M.Hussey  79,85   80,71
G.Headley 60,83   67,94
W.Hammond 58,46   64,84
G.Sobers  57,78   64,45
S.Barnes  63,06   64,29
J.Kallis  56,94   63,81
G.Pollock 60,97   63,03
E.Paynter 59,23   62,45
R.Ponting 59,41   61,77
As usual, feel free to request any other players.
And for those of you wondering why Andy Flower's compromise score is greater than both his regression and individual scores... I will work it out later if you don't beat me to it. It might be like when someone moves from country A to country B and raises the average IQ of both countries.
# posted by David Barry : 01:06

![]()
Subscribe to Posts [Atom]