Saturday, March 01, 2014
Highest scores
Recently I got thinking about Flappy Bird scores, and noted that they should be similar to cricket scores in the way they're distributed.
Translating the problem to cricket, the question is, "What is the relationship between a batsman's highest score, his average, and the number of innings he's batted in?" A follow-up question is how well such a formula predicts, say, the average based on the innings and highest score. I expected there to be quite a lot of scatter (assessing a batsman on just one innings!), but the correlation ended up being pretty decent. This isn't a particularly useful correlation, but I found it fun to play with.
Given the average, the probability that a batsman makes a score less than x is roughly (1 - exp(-x/avg)). Treating each innings as independent of the others, the probability that all N of a batsman's innings are less than x is therefore (1 - exp(-x/avg))N.
A natural "expected" highest score, given the batsman's average, would be the value x such that the probability that all innings are less than x is 1/2. Calling this value HS, we have
(1 - exp(-HS/avg))N = 1/2,
which is the basic relation between highest score, average, and number of innings batted.
Solving for HS (i.e., what highest score do we expect, given average and innings batted?):
HS = -avg * ln(1 - 0.51/N).
Solving for avg (given only highest score and innings batted, what do we think the batsman's average is?):
avg = -HS / ln(1 - 0.51/N).
Using the latter formula as a predictor works surprisingly (to me) well:
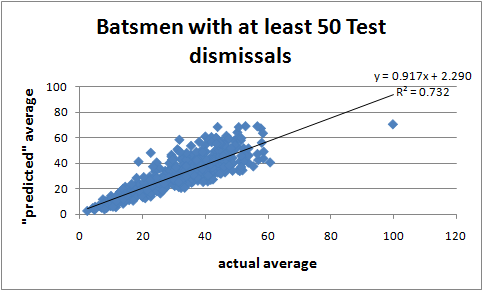
The weird qualification of 50 dismissals rather than innings is because I began by including all abtsmen with at least 2 dismissals, and at sample sizes this small, I figured dismissals would be useful to avoid not-out irregularities. (The R-squared is actually a bit higher, about 0.78, in that expanded sample.)
I doubt I'll ever use this formula, but Perhaps the most amusing individual result is Shane Warne: based on his average and innings batted, his "predicted" high score is... 98! So he didn't quite deserve that hundred after all.
Full table, straight off Statsguru – I was so lazy that I didn't even turn off the ICC game.
predict one based
real on the other
Player Inns NO HS avg HS avg
DG Bradman (Aus) 80 10 334 99.9 475.0 70.3
H Sutcliffe (Eng) 84 9 194 60.7 291.6 40.4
KF Barrington (Eng) 131 15 256 58.7 307.7 48.8
ED Weekes (WI) 81 5 207 58.6 279.3 43.4
WR Hammond (Eng) 140 16 336 58.5 310.4 63.3
KC Sangakkara (SL) 209 17 319 58.1 331.6 55.9
GS Sobers (WI) 160 21 365 57.8 314.5 67.0
JB Hobbs (Eng) 102 7 211 56.9 284.4 42.2
CL Walcott (WI) 74 7 220 56.7 265.0 47.1
L Hutton (Eng) 138 15 364 56.7 300.1 68.7
JH Kallis (ICC/SA) 280 40 224 55.4 332.4 37.3
GS Chappell (Aus) 151 19 247 53.9 290.1 45.9
AD Nourse (SA) 62 7 231 53.8 242.1 51.3
SR Tendulkar (India) 329 33 248 53.8 331.5 40.2
BC Lara (ICC/WI) 232 6 400 52.9 307.5 68.8
Javed Miandad (Pak) 189 21 280 52.6 294.9 49.9
R Dravid (ICC/India) 286 32 270 52.3 315.1 44.8
Mohammad Yousuf (Pak) 156 12 223 52.3 283.3 41.2
AB de Villiers (SA) 152 16 278 52.3 281.9 51.6
S Chanderpaul (WI) 261 45 203 51.9 308.1 34.2
RT Ponting (Aus) 287 29 257 51.9 312.5 42.6
HM Amla (SA) 130 11 311 51.6 270.0 59.4
A Flower (Zim) 112 19 232 51.5 262.2 45.6
MEK Hussey (Aus) 137 16 195 51.5 272.5 36.9
Younis Khan (Pak) 158 14 313 51.4 279.1 57.6
SM Gavaskar (India) 214 16 236 51.1 293.1 41.2
SR Waugh (Aus) 260 46 200 51.1 302.7 33.7
MJ Clarke (Aus) 178 19 329 50.8 282.0 59.3
ML Hayden (Aus) 184 14 380 50.7 283.2 68.1
AR Border (Aus) 265 44 205 50.6 300.7 34.5
DPMD Jayawardene (SL) 240 15 374 50.3 294.2 63.9
IVA Richards (WI) 182 12 291 50.2 279.9 52.2
DCS Compton (Eng) 131 15 278 50.1 262.5 53.0
Inzamam-ul-Haq (ICC/Pak) 200 22 329 49.6 281.1 58.1
FMM Worrell (WI) 87 9 261 49.5 239.3 54.0
V Sehwag (ICC/India) 180 6 319 49.3 274.4 57.4
B Mitchell (SA) 80 9 189 48.9 232.3 39.8
TT Samaraweera (SL) 132 20 231 48.8 256.1 44.0
Misbah-ul-Haq (Pak) 80 14 161 48.8 231.7 33.9
GC Smith (ICC/SA) 203 13 277 48.7 276.8 48.8
RN Harvey (Aus) 137 10 205 48.4 256.0 38.8
KD Walters (Aus) 125 14 250 48.3 250.8 48.1
SJ McCabe (Aus) 62 5 232 48.2 216.9 51.6
ER Dexter (Eng) 102 8 205 47.9 239.2 41.0
G Boycott (Eng) 193 23 246 47.7 268.7 43.7
VS Hazare (India) 52 6 164 47.7 206.1 37.9
EH Hendren (Eng) 83 9 205 47.6 228.1 42.8
AC Gilchrist (Aus) 137 20 204 47.6 251.8 38.6
SM Nurse (WI) 54 1 258 47.6 207.6 59.1
RB Kanhai (WI) 137 6 256 47.5 251.4 48.4
KP Pietersen (Eng) 181 8 227 47.3 263.2 40.8
WM Lawry (Aus) 123 12 210 47.2 244.3 40.5
LRPL Taylor (NZ) 98 9 217 46.9 232.6 43.8
RB Simpson (Aus) 111 7 311 46.8 237.8 61.2
PBH May (Eng) 106 9 285 46.8 235.4 56.6
CH Lloyd (WI) 175 14 242 46.7 258.2 43.7
AL Hassett (Aus) 69 3 198 46.6 214.4 43.0
DM Jones (Aus) 89 11 216 46.6 226.2 44.5
AN Cook (Eng) 183 10 294 46.5 259.4 52.7
AR Morris (Aus) 79 3 206 46.5 220.3 43.5
IJL Trott (Eng) 87 6 226 46.5 224.7 46.7
DR Martyn (Aus) 109 14 165 46.4 234.7 32.6
DL Amiss (Eng) 88 10 262 46.3 224.5 54.0
AD Mathews (SL) 62 12 157 46.2 207.7 34.9
M Leyland (Eng) 65 5 187 46.1 209.4 41.1
WM Woodfull (Aus) 54 4 161 46.0 200.6 36.9
VVS Laxman (India) 225 34 281 46.0 265.9 48.6
EJ Barlow (SA) 57 2 201 45.7 202.0 45.5
NC O'Neill (Aus) 69 8 181 45.6 209.8 39.3
Saeed Anwar (Pak) 91 2 188 45.5 222.2 38.5
IR Bell (Eng) 170 22 235 45.4 250.0 42.7
MD Crowe (NZ) 131 11 299 45.4 237.9 57.0
JL Langer (Aus) 182 12 250 45.3 252.3 44.9
G Kirsten (SA) 176 15 275 45.3 250.7 49.6
CC Hunte (WI) 78 6 260 45.1 213.0 55.0
SM Katich (Aus) 99 6 157 45.0 223.6 31.6
M Azharuddin (India) 147 9 199 45.0 241.3 37.1
Zaheer Abbas (Pak) 124 11 274 44.8 232.4 52.8
MH Richardson (NZ) 65 3 145 44.8 203.5 31.9
CG Greenidge (WI) 185 16 226 44.7 249.9 40.4
GP Thorpe (Eng) 179 28 200 44.7 248.1 36.0
GM Turner (NZ) 73 6 259 44.6 208.1 55.6
AI Kallicharran (WI) 109 10 187 44.4 224.9 36.9
RB Richardson (WI) 146 12 194 44.4 237.6 36.2
TW Graveney (Eng) 123 13 258 44.4 230.0 49.8
Shoaib Mohammad (Pak) 68 7 203 44.3 203.6 44.2
AH Jones (NZ) 74 8 186 44.3 207.0 39.8
DI Gower (Eng) 204 18 215 44.3 251.6 37.8
DJ Cullinan (SA) 115 12 275 44.2 226.1 53.8
G Gambhir (India) 96 5 206 44.2 218.0 41.7
MC Cowdrey (Eng) 188 15 182 44.1 246.9 32.5
Hanif Mohammad (Pak) 97 8 337 44.0 217.5 68.2
ME Trescothick (Eng) 143 10 219 43.8 233.5 41.1
Saleem Malik (Pak) 154 22 237 43.7 236.2 43.8
RA Smith (Eng) 112 15 175 43.7 222.2 34.4
EAB Rowan (SA) 50 5 236 43.7 187.1 55.1
DC Boon (Aus) 190 20 200 43.7 245.1 35.6
JH Edrich (Eng) 127 9 310 43.5 227.0 59.5
MA Taylor (Aus) 186 13 334 43.5 243.3 59.7
IR Redpath (Aus) 120 11 171 43.5 224.1 33.2
BF Butcher (WI) 78 6 209 43.1 203.8 44.2
PA de Silva (SL) 159 11 267 43.0 233.7 49.1
DA Warner (Aus) 54 3 180 42.9 187.0 41.3
HP Tillakaratne (SL) 131 25 204 42.9 224.8 38.9
MJ Slater (Aus) 131 7 219 42.8 224.6 41.8
C Washbrook (Eng) 66 6 195 42.8 195.3 42.7
GA Gooch (Eng) 215 6 333 42.6 244.4 58.0
M Amarnath (India) 113 10 138 42.5 216.6 27.1
RC Fredericks (WI) 109 7 169 42.5 215.0 33.4
IM Chappell (Aus) 136 10 196 42.4 224.1 37.1
JB Stollmeyer (WI) 56 5 160 42.3 186.2 36.4
DL Haynes (WI) 202 25 184 42.3 240.1 32.4
PR Umrigar (India) 94 8 223 42.2 207.4 45.4
SC Ganguly (India) 188 17 239 42.2 236.4 42.6
DB Vengsarkar (India) 185 22 166 42.1 235.5 29.7
NS Sidhu (India) 78 2 201 42.1 199.2 42.5
DJ McGlew (SA) 64 6 255 42.1 190.6 56.3
CH Gayle (WI) 174 9 333 42.0 232.2 60.2
HH Gibbs (SA) 154 7 228 42.0 226.8 42.2
GR Viswanath (India) 155 10 222 41.9 226.9 41.0
ME Waugh (Aus) 209 17 153 41.8 238.8 26.8
CG Macartney (Aus) 55 4 170 41.8 183.0 38.8
AG Prince (SA) 104 16 162 41.6 208.8 32.3
MP Vaughan (Eng) 147 9 197 41.4 222.1 36.8
JC Adams (WI) 90 17 208 41.3 200.9 42.7
GN Yallop (Aus) 70 3 268 41.1 190.0 58.0
GRJ Matthews (Aus) 53 8 130 41.1 178.4 29.9
KC Wessels (Aus/SA) 71 3 179 41.0 190.0 38.6
TM Dilshan (SL) 145 11 193 41.0 219.1 36.1
AJ Strauss (Eng) 178 6 177 40.9 227.1 31.9
PH Parfitt (Eng) 52 6 131 40.9 176.9 30.3
MJ Prior (Eng) 116 20 131 40.8 209.2 25.6
HW Taylor (SA) 76 4 176 40.8 191.7 37.4
LEG Ames (Eng) 72 12 149 40.6 188.5 32.1
PD Collingwood (Eng) 115 10 206 40.6 207.4 40.3
W Bardsley (Aus) 66 5 193 40.5 184.6 42.3
AW Greig (Eng) 93 4 148 40.4 198.2 30.2
Saeed Ahmed (Pak) 78 4 172 40.4 191.0 36.4
B Sutcliffe (NZ) 76 8 230 40.1 188.5 48.9
ST Jayasuriya (SL) 188 14 340 40.1 224.6 60.7
BL D'Oliveira (Eng) 70 8 158 40.1 185.1 34.2
SP Fleming (NZ) 189 10 274 40.1 224.7 48.8
RR Sarwan (WI) 154 8 291 40.0 216.3 53.8
WJ Edrich (Eng) 63 2 219 40.0 180.6 48.5
KWR Fletcher (Eng) 96 14 216 39.9 196.9 43.8
HA Gomes (WI) 91 11 143 39.6 193.4 29.3
AJ Stewart (Eng) 235 21 190 39.5 230.4 32.6
BM McMillan (SA) 62 12 113 39.4 177.1 25.1
CC McDonald (Aus) 83 4 170 39.3 188.3 35.5
DN Sardesai (India) 55 4 212 39.2 171.8 48.4
C Hill (Aus) 89 2 191 39.2 190.5 39.3
Mushtaq Mohammad (Pak) 100 7 201 39.2 194.9 40.4
Azhar Ali (Pak) 60 4 157 39.1 174.8 35.1
VL Manjrekar (India) 92 10 189 39.1 191.4 38.6
VT Trumper (Aus) 89 8 214 39.0 189.7 44.0
MS Atapattu (SL) 156 15 249 39.0 211.4 46.0
AP Gurusinha (SL) 70 7 143 38.9 179.8 31.0
Majid Khan (Pak) 106 5 167 38.9 195.9 33.2
Asif Iqbal (Pak) 99 7 175 38.9 192.9 35.2
MS Dhoni (India) 130 15 224 38.8 203.0 42.8
Taufeeq Umar (Pak) 81 5 236 38.7 184.5 49.5
WW Armstrong (Aus) 84 10 159 38.7 185.7 33.1
CD McMillan (NZ) 91 10 142 38.5 187.7 29.1
PJP Burge (Aus) 68 8 181 38.2 175.2 39.4
Mudassar Nazar (Pak) 116 8 231 38.1 195.1 45.1
BB McCullum (NZ) 145 8 302 38.1 203.6 56.5
Shakib Al Hasan (Ban) 65 5 144 38.0 172.6 31.7
JG Wright (NZ) 148 7 185 37.8 202.9 34.5
Imran Khan (Pak) 126 25 136 37.7 196.2 26.1
MA Atherton (Eng) 212 7 185 37.7 215.8 32.3
Ijaz Ahmed (Pak) 92 4 211 37.7 184.3 43.1
JV Coney (NZ) 85 14 174 37.6 180.8 36.2
PE Richardson (Eng) 56 1 126 37.5 164.8 28.6
KR Stackpole (Aus) 80 5 207 37.4 177.9 43.6
KJ Hughes (Aus) 124 6 213 37.4 194.1 41.0
ND McKenzie (SA) 94 7 226 37.4 183.7 46.0
AN Petersen (SA) 52 3 182 37.3 161.3 42.1
N Hussain (Eng) 171 16 207 37.2 204.9 37.6
SV Manjrekar (India) 61 6 218 37.1 166.5 48.6
Mohsin Khan (Pak) 79 6 200 37.1 175.9 42.2
NJ Astle (NZ) 137 10 222 37.0 195.8 42.0
KR Miller (Aus) 87 7 147 37.0 178.8 30.4
Tamim Iqbal (Ban) 62 0 151 36.6 164.6 33.6
CL Hooper (WI) 173 15 233 36.5 201.3 42.2
WJ Cronje (SA) 111 9 135 36.4 184.9 26.6
KS Williamson (NZ) 56 2 135 36.4 160.0 30.7
SR Watson (Aus) 95 3 176 36.3 178.9 35.7
JDP Oram (NZ) 59 10 133 36.3 161.6 29.9
Wasim Raja (Pak) 92 14 125 36.2 176.9 25.6
AJ Lamb (Eng) 139 10 142 36.1 191.4 26.8
FE Woolley (Eng) 98 7 154 36.1 178.7 31.1
Sadiq Mohammad (Pak) 74 2 166 35.8 167.4 35.5
AL Logie (WI) 78 9 130 35.8 169.2 27.5
RJ Shastri (India) 121 14 206 35.8 184.9 39.9
A Ranatunga (SL) 155 12 135 35.7 193.2 24.9
JN Rhodes (SA) 80 9 117 35.7 169.5 24.6
CG Borde (India) 97 11 177 35.6 176.0 35.8
MW Gatting (Eng) 138 14 207 35.6 188.3 39.1
MN Samuels (WI) 90 6 260 35.5 172.9 53.4
BJ Haddin (Aus) 94 9 169 35.5 174.4 34.4
JA Rudolph (SA) 83 9 222 35.4 169.7 46.4
Aamer Sohail (Pak) 83 3 205 35.3 169.0 42.8
GM Ritchie (Aus) 53 5 146 35.2 152.9 33.6
MAK Pataudi (India) 83 3 203 34.9 167.2 42.4
JP Crawley (Eng) 61 9 156 34.6 155.2 34.8
MA Butcher (Eng) 131 7 173 34.6 181.3 33.0
TL Goddard (SA) 78 5 112 34.5 162.9 23.7
TW Hayward (Eng) 60 2 137 34.5 153.9 30.7
W Jaffer (India) 58 1 212 34.1 151.2 47.8
GS Blewett (Aus) 79 4 214 34.0 161.3 45.1
Mohammad Hafeez (Pak) 70 6 196 34.0 156.9 42.4
WR Endean (SA) 52 4 162 34.0 146.8 37.5
Yuvraj Singh (India) 62 6 169 33.9 152.6 37.6
AP Sheahan (Aus) 53 6 127 33.9 147.3 29.2
AC MacLaren (Eng) 61 4 140 33.9 151.8 31.2
IT Botham (Eng) 161 6 208 33.5 182.8 38.2
CL Cairns (NZ) 104 5 158 33.5 168.1 31.5
KD Mackay (Aus) 52 7 89 33.5 144.8 20.6
Yashpal Sharma (India) 59 11 140 33.5 148.8 31.5
Shoaib Malik (Pak) 54 6 148 33.5 145.9 33.9
AC Hudson (SA) 63 3 163 33.5 151.0 36.1
DW Randall (Eng) 79 5 174 33.4 158.2 36.7
JR Reid (NZ) 108 5 142 33.3 168.1 28.1
GR Marsh (Aus) 93 7 138 33.2 162.7 28.1
WW Hinds (WI) 80 1 213 33.0 156.9 44.8
L Klusener (SA) 69 11 174 32.9 151.3 37.8
APE Knott (Eng) 149 15 135 32.8 176.0 25.1
M Prabhakar (India) 58 9 120 32.7 144.7 27.1
NT Paranavitana (SL) 60 5 111 32.6 145.5 24.9
P Roy (India) 79 4 173 32.6 154.3 36.5
CJ Tavare (Eng) 56 2 149 32.5 142.9 33.9
GP Howarth (NZ) 83 5 147 32.4 155.4 30.7
Mushfiqur Rahim (Ban) 71 4 200 32.4 150.3 43.2
SL Campbell (WI) 93 4 208 32.4 158.8 42.4
SM Pollock (SA) 156 39 111 32.3 175.1 20.5
BE Congdon (NZ) 114 7 176 32.2 164.5 34.5
JM Parks (Eng) 68 7 108 32.2 147.7 23.5
MS Sinclair (NZ) 56 5 214 32.1 141.0 48.7
Imran Farhat (Pak) 77 2 128 32.0 150.9 27.1
PJL Dujon (WI) 115 11 139 31.9 163.4 27.2
Rameez Raja (Pak) 94 5 122 31.8 156.4 24.8
GM Wood (Aus) 112 6 172 31.8 162.0 33.8
BA Young (NZ) 68 4 267 31.8 145.9 58.2
A Flintoff (Eng/ICC) 130 9 167 31.8 166.4 31.9
RES Wyatt (Eng) 64 6 149 31.7 143.6 32.9
MJK Smith (Eng) 78 6 121 31.6 149.5 25.6
NJ Contractor (India) 52 1 108 31.6 136.6 25.0
CPS Chauhan (India) 68 2 97 31.6 144.9 21.1
MH Mankad (India) 72 5 231 31.5 146.3 49.7
DJ Bravo (WI) 71 1 113 31.4 145.6 24.4
GA Hick (Eng) 114 6 178 31.3 159.9 34.9
HAPW Jayawardene (SL) 77 11 154 31.2 147.2 32.7
MG Burgess (NZ) 92 6 119 31.2 152.6 24.3
GT Dowling (NZ) 77 3 239 31.2 146.9 50.7
FM Engineer (India) 87 3 121 31.1 150.3 25.0
AL Wadekar (India) 71 3 143 31.1 144.0 30.9
N Kapil Dev (India) 184 15 163 31.1 173.4 29.2
Habibul Bashar (Ban) 99 1 113 30.9 153.3 22.8
Kamran Akmal (Pak) 92 6 158 30.8 150.6 32.3
JT Tyldesley (Eng) 55 1 138 30.8 134.7 31.5
KLT Arthurton (WI) 50 5 157 30.7 131.6 36.6
ML Jaisimha (India) 71 4 129 30.7 142.2 27.8
MJ Greatbatch (NZ) 71 5 146 30.6 141.9 31.5
BA Edgar (NZ) 68 4 161 30.6 140.4 35.1
Salman Butt (Pak) 62 0 122 30.5 137.0 27.1
JHB Waite (SA) 86 7 134 30.4 146.9 27.8
T Taibu (Zim) 54 3 153 30.3 132.2 35.1
MV Boucher (ICC/SA) 206 24 125 30.3 172.6 21.9
RA McLean (SA) 73 3 142 30.3 141.2 30.5
MA Noble (Aus) 73 7 133 30.3 141.0 28.5
BF Hastings (NZ) 56 6 117 30.2 132.8 26.6
W Rhodes (Eng) 98 21 179 30.2 149.6 36.1
HH Dippenaar (SA) 62 5 177 30.1 135.6 39.3
DL Vettori (ICC/NZ) 173 23 140 30.1 166.2 25.4
AD Gaekwad (India) 70 4 201 30.1 138.9 43.5
K Srikkanth (India) 72 3 123 29.9 138.9 26.5
AW Nourse (SA) 83 8 111 29.8 142.6 23.2
TE Bailey (Eng) 91 14 134 29.7 145.2 27.5
MJ Guptill (NZ) 59 1 189 29.6 131.8 42.5
GW Flower (Zim) 123 6 201 29.5 153.1 38.8
GJ Whittall (Zim) 82 7 203 29.4 140.6 42.5
Imtiaz Ahmed (Pak) 72 1 209 29.3 136.1 45.0
RS Mahanama (SL) 89 1 225 29.3 142.2 46.3
Rashid Latif (Pak) 57 9 150 28.8 127.0 34.0
Abdul Razzaq (Pak) 77 9 134 28.6 134.9 28.4
J Darling (Aus) 60 2 178 28.6 127.6 39.9
Moin Khan (Pak) 104 8 137 28.6 143.2 27.3
KG Viljoen (SA) 50 2 124 28.4 121.8 28.9
MJ Horne (NZ) 65 2 157 28.4 129.0 34.5
RD Jacobs (WI) 112 21 118 28.3 144.0 23.2
RP Arnold (SL) 69 4 123 28.0 129.0 26.7
IA Healy (Aus) 182 23 161 27.4 152.6 28.9
MR Ramprakash (Eng) 92 6 154 27.3 133.7 31.5
D Ramdin (WI) 95 13 166 27.3 134.2 33.7
ADR Campbell (Zim) 109 4 103 27.2 137.7 20.4
Sir RJ Hadlee (NZ) 134 19 151 27.2 143.1 28.7
RC Russell (Eng) 86 16 128 27.1 130.8 26.5
KR Rutherford (NZ) 99 8 107 27.1 134.5 21.6
SMH Kirmani (India) 124 22 102 27.0 140.3 19.7
SV Carlisle (Zim) 66 6 118 26.9 122.7 25.9
H Masakadza (Zim) 50 2 119 26.9 115.3 27.8
P Willey (Eng) 50 6 102 26.9 115.3 23.8
J Dyson (Aus) 58 7 127 26.6 118.1 28.6
PR Reiffel (Aus) 50 14 79 26.5 113.7 18.4
RW Marsh (Aus) 150 13 132 26.5 142.6 24.5
AC Parore (NZ) 128 19 110 26.3 137.2 21.1
JJ Crowe (NZ) 65 4 128 26.2 119.3 28.2
RS Kaluwitharana (SL) 78 4 132 26.1 123.5 27.9
G Miller (Eng) 51 4 98 25.8 111.1 22.8
D Ganga (WI) 86 2 135 25.7 124.0 28.0
KS More (India) 64 14 73 25.7 116.4 16.1
RG Nadkarni (India) 67 12 122 25.7 117.6 26.7
IDS Smith (NZ) 88 17 173 25.6 123.9 35.7
DA Allen (Eng) 51 15 88 25.5 109.8 20.4
MW Tate (Eng) 52 5 100 25.5 110.2 23.1
N Boje (SA) 62 10 85 25.2 113.5 18.9
SA Durani (India) 50 2 104 25.0 107.3 24.3
DS Smith (WI) 58 2 108 24.7 109.5 24.4
AK Davidson (Aus) 61 7 80 24.6 110.2 17.8
GS Ramchand (India) 53 5 109 24.6 106.8 25.1
JM Parker (NZ) 63 2 121 24.6 110.8 26.8
SE Gregory (Aus) 100 7 201 24.5 122.0 40.4
C White (Eng) 50 7 121 24.5 104.8 28.2
R Benaud (Aus) 97 7 122 24.5 120.9 24.7
V Pollard (NZ) 59 7 116 24.3 108.3 26.1
WPUJC Vaas (SL) 162 35 100 24.3 132.7 18.3
DJ Richardson (SA) 64 8 109 24.3 109.9 24.1
SCJ Broad (Eng) 95 12 169 24.2 119.2 34.3
SC Williams (WI) 52 3 128 24.1 104.4 29.6
NR Mongia (India) 68 8 152 24.0 110.3 33.1
Mohammad Ashraful (Ban) 119 5 190 24.0 123.6 36.9
GO Jones (Eng) 53 4 100 23.9 103.8 23.0
G Giffen (Aus) 53 0 161 23.4 101.4 37.1
R Illingworth (Eng) 90 11 113 23.2 113.2 23.2
AC Bannerman (Aus) 50 2 94 23.1 98.9 21.9
CC Lewis (Eng) 51 3 117 23.0 99.1 27.2
DL Murray (WI) 96 9 91 22.9 113.0 18.4
JM Brearley (Eng) 66 3 91 22.9 104.4 19.9
DD Ebrahim (Zim) 55 1 94 22.7 99.3 21.5
WAS Oldfield (Aus) 80 17 65 22.7 107.7 13.7
S Madan Lal (India) 62 16 74 22.7 101.9 16.4
Wasim Akram (Pak) 147 19 257 22.6 121.3 48.0
JE Emburey (Eng) 96 20 75 22.5 111.2 15.2
MG Johnson (Aus) 87 14 123 22.4 108.4 25.4
CB Wishart (Zim) 50 1 114 22.4 96.0 26.6
HH Streak (Zim) 107 18 127 22.4 112.7 25.2
FJ Titmus (Eng) 76 11 84 22.3 104.8 17.9
Intikhab Alam (Pak) 77 10 138 22.3 105.0 29.3
GP Swann (Eng) 76 14 85 22.1 103.9 18.1
Javed Omar (Ban) 80 2 119 22.1 104.8 25.0
DJG Sammy (WI) 63 2 106 21.7 97.9 23.5
KJ Wadsworth (NZ) 51 4 80 21.5 92.5 18.6
KD Ghavri (India) 57 14 86 21.2 93.7 19.5
RR Lindwall (Aus) 84 13 118 21.2 101.6 24.6
AF Giles (Eng) 81 13 59 20.9 99.5 12.4
DN Patel (NZ) 66 8 99 20.7 94.3 21.7
AFA Lilley (Eng) 52 8 84 20.5 88.7 19.4
TG Evans (Eng) 133 14 104 20.5 107.8 19.8
JG Bracewell (NZ) 60 11 110 20.4 91.2 24.6
BR Taylor (NZ) 50 6 124 20.4 87.4 28.9
S Abid Ali (India) 53 3 81 20.4 88.4 18.6
B Lee (Aus) 90 18 64 20.2 98.1 13.1
H Trumble (Aus) 57 14 70 19.8 87.4 15.9
HDPK Dharmasena (SL) 51 7 62 19.7 84.9 14.4
B Yardley (Aus) 54 4 74 19.6 85.3 17.0
Khaled Mashud (Ban) 84 10 103 19.0 91.4 21.5
TG Southee (NZ) 50 5 77 19.0 81.4 18.0
MD Marshall (WI) 107 11 92 18.9 95.1 18.2
JN Gillespie (Aus) 93 28 201 18.7 91.8 41.0
Mohammad Rafique (Ban) 63 6 111 18.6 83.8 24.6
IWG Johnson (Aus) 66 12 77 18.5 84.4 16.9
Harbhajan Singh (India) 142 22 115 18.4 97.7 21.6
J Briggs (Eng) 50 5 121 18.1 77.6 28.2
DG Cork (Eng) 56 8 59 18.0 79.2 13.4
A Kumble (India) 173 32 110 17.8 98.1 19.9
Sarfraz Nawaz (Pak) 72 13 90 17.7 82.3 19.4
PH Edmonds (Eng) 65 15 64 17.5 79.6 14.1
SK Warne (Aus) 199 17 99 17.3 98.1 17.5
JJ Kelly (Aus) 56 17 46 17.0 74.9 10.5
HJ Tayfield (SA) 60 9 75 16.9 75.5 16.8
MG Hughes (Aus) 70 8 72 16.6 76.9 15.6
Nasim-ul-Ghani (Pak) 50 5 101 16.6 71.1 23.6
BL Cairns (NZ) 65 8 64 16.3 74.0 14.1
RW Taylor (Eng) 83 12 97 16.3 78.0 20.3
GF Lawson (Aus) 68 12 74 16.0 73.3 16.1
Wasim Bari (Pak) 112 26 85 15.9 80.8 16.7
WW Hall (WI) 66 14 50 15.7 71.8 11.0
JM Blackham (Aus) 62 11 74 15.7 70.5 16.4
Abdul Qadir (Pak) 77 11 61 15.6 73.5 12.9
DR Pringle (Eng) 50 4 63 15.1 64.7 14.7
ATW Grout (Aus) 67 8 74 15.1 69.0 16.2
AME Roberts (WI) 62 11 68 14.9 67.2 15.1
CM Old (Eng) 66 9 65 14.8 67.6 14.2
PAJ DeFreitas (Eng) 68 5 88 14.8 68.0 19.2
SB Doull (NZ) 50 11 46 14.6 62.6 10.7
Saqlain Mushtaq (Pak) 78 14 101 14.5 68.5 21.4
RO Collinge (NZ) 50 13 68 14.4 61.7 15.9
DW Steyn (SA) 89 21 76 14.3 69.2 15.6
PM Siddle (Aus) 76 11 51 14.2 67.0 10.8
J Srinath (India) 92 21 76 14.2 69.5 15.5
VA Holder (WI) 59 11 42 14.2 63.2 9.4
Fazal Mahmood (Pak) 50 6 60 14.1 60.4 14.0
JC Laker (Eng) 63 15 63 14.1 63.6 14.0
CV Grimmett (Aus) 50 10 50 13.9 59.7 11.7
FS Trueman (Eng) 85 14 39 13.8 66.5 8.1
MA Holding (WI) 76 10 73 13.8 64.8 15.5
GAR Lock (Eng) 63 9 89 13.7 62.0 19.7
DK Lillee (Aus) 90 24 73 13.7 66.8 15.0
JA Snow (Eng) 71 14 73 13.5 62.7 15.8
GR Dilley (Eng) 58 19 56 13.4 59.2 12.6
Iqbal Qasim (Pak) 57 15 56 13.1 57.7 12.7
HMRKB Herath (SL) 70 15 80 13.0 59.9 17.3
Mashrafe Mortaza (Ban) 67 5 79 12.9 58.8 17.3
JR Thomson (Aus) 73 20 49 12.8 59.7 10.5
AV Bedser (Eng) 71 15 79 12.8 59.1 17.0
D Gough (Eng) 86 18 65 12.6 60.6 13.5
J Garner (WI) 68 14 60 12.4 57.1 13.1
CEL Ambrose (WI) 145 29 53 12.4 66.3 9.9
M Morkel (SA) 65 10 40 12.3 55.8 8.8
GD McKenzie (Aus) 89 12 76 12.3 59.6 15.6
CJ McDermott (Aus) 90 13 42 12.2 59.4 8.6
IR Bishop (WI) 63 11 48 12.2 54.9 10.6
Z Khan (India) 127 24 75 12.0 62.3 14.4
SJ Harmison (Eng/ICC) 86 23 49 11.8 56.9 10.2
Mushtaq Ahmed (Pak) 72 16 59 11.7 54.4 12.7
S Venkataraghavan (India) 76 12 64 11.7 54.9 13.6
M Muralitharan (ICC/SL) 164 56 67 11.7 63.8 12.3
AA Mallett (Aus) 50 13 43 11.6 49.8 10.0
Mohammad Sami (Pak) 56 14 49 11.6 51.0 11.1
DL Underwood (Eng) 116 35 45 11.6 59.2 8.8
RC Motz (NZ) 56 3 60 11.5 50.8 13.6
RGD Willis (Eng) 128 55 28 11.5 60.0 5.4
EAS Prasanna (India) 84 20 37 11.5 55.1 7.7
JB Statham (Eng) 87 28 38 11.4 55.3 7.9
AA Donald (SA) 94 33 37 10.7 52.5 7.5
MS Kasprowicz (Aus) 54 12 25 10.6 46.2 5.7
AR Caddick (Eng) 95 12 49 10.4 51.1 10.0
JM Anderson (Eng) 127 47 34 10.4 54.0 6.5
Waqar Younis (Pak) 120 21 45 10.2 52.6 8.7
Shahadat Hossain (Ban) 65 17 40 10.2 46.3 8.8
Shoaib Akhtar (Pak) 67 13 47 10.1 46.1 10.3
Umar Gul (Pak) 67 9 65 9.9 45.5 14.2
M Ntini (SA) 116 45 32 9.8 50.4 6.2
RM Hogg (Aus) 58 13 52 9.8 43.2 11.7
GP Wickramasinghe (SL) 64 5 51 9.4 42.6 11.3
I Sharma (India) 81 28 31 9.2 43.9 6.5
PR Adams (SA) 55 15 35 9.0 39.4 8.0
BS Bedi (India) 101 28 50 9.0 44.8 10.0
EJ Chatfield (NZ) 54 33 21 8.6 37.4 4.8
M Dillon (WI) 68 3 43 8.4 38.7 9.4
DK Morrison (NZ) 71 26 42 8.4 39.0 9.1
S Ramadhin (WI) 58 14 44 8.2 36.3 9.9
CD Collymore (WI) 52 27 16 7.9 34.1 3.7
DBL Powell (WI) 57 5 36 7.8 34.5 8.2
CA Walsh (WI) 185 61 30 7.5 42.1 5.4
ARC Fraser (Eng) 67 15 32 7.5 34.1 7.0
GD McGrath (Aus) 138 51 61 7.4 39.0 11.5
MJ Hoggard (Eng) 92 27 38 7.3 35.6 7.8
Danish Kaneria (Pak) 84 33 29 7.1 33.9 6.0
LR Gibbs (WI) 109 39 25 7.0 35.3 4.9
FH Edwards (WI) 88 28 30 6.6 31.8 6.2
TM Alderman (Aus) 53 22 26 6.5 28.4 6.0
DE Malcolm (Eng) 58 19 29 6.1 26.8 6.5
PCR Tufnell (Eng) 59 29 22 5.1 22.7 4.9
MS Panesar (Eng) 68 23 26 4.9 22.4 5.7
AL Valentine (WI) 51 21 14 4.7 20.2 3.3
BS Chandrasekhar (India) 80 39 22 4.1 19.3 4.6
CS Martin (NZ) 104 52 12 2.4 11.8 2.4Thursday, January 16, 2014
Some women's T20 record lists
The other day, Avi Singh tweeted:
@RafNicholson From this match today http://t.co/1TwKWX1n6Q do you know if Auckland's 189 & @sjmac7's 131* are women's domestic T20 records?
— Avi Singh (@MannerOfSpeakin) January 10, 2014As best I can tell, McGlashan's score is a women's T20 record, but the team total is definitely not a world record.
I am not aware of any site that compiles record lists of women's List A or T20 cricket, so I have filled a small part of that gap with some tables at the end of this post. The stats are in some cases not complete. There are many gaps in CricketArchive's database – preliminary rounds of at least one tournament in India are completely missing; I ran into matches in both England and South Africa where only very partial scores were available, and in these cases I did not add them to my own database; I ran into matches in Australia and England where some players' names were not recorded (one might have taken five wickets in an innings!); there are as far as I can see no West Indies domestic games classified as WT20 ("wtt") by CricketArchive – for reasons unknown to me (design? accident? they are slowly systematising their classifications and haven't reached the West Indies yet?), the WI domestic tournaments have their matches classified as miscellaneous.
The above paragraph is not intended to be an exhaustive list of the gaps in the data – they just happen to be the cases I consciously noticed, and in some cases I just tweaked my code that was parsing the scorecards, so that I was blissfully unaware of any subsequent gaps of that type.
On a much more minor note, while most of the matches played by the batsmen in the tables below have the balls-faced recorded, there are a couple (literally 2 for Charlotte Edwards) where this isn't the case, and such innings are ignored when calculating the strike rate.
The 'wtt' columns in some tables below refer to the CricketArchive match ID's. I don't have the scorecard URL's handy, but you can go to CA's scorecard Oracle, and enter, e.g., wtt1264 as the match ID, and that will bring up the scorecard showing McGlashan's 131 not out. My hope is that the values I give in the tables below will become obsolete as West Indies (and other?) domestic games are re-classified by CA as wtt.
CA doesn't present record lists for women's domestic matches, but they do show the stats for individual players (useful for me since it allowed me to check my results). In light of this, I think that it shouldn't be too hard for CA to add women's T20 and List A to the list of their stats options, and I would encourage anyone interested to lobby CA on that front. I don't intend to maintain my own database regularly, nor to update the tables in this post. I am willing to compile record lists for women's List A if there is demand for it.
Leading run-scorers
name                 mat    inns      no    hs      runs     avg      sr
CM Edwards           109     105      15    88      3043    33.8   112.7
LJ Poulton           101     100       9   103*     2692    29.6   117.7
SJ Taylor            101      95      18    77      2592    33.7   110.3
SW Bates             102     102      10    78*     2513    27.3   101.2
MM Lanning            88      88      12    79      2455    32.3   116.9
AJ Blackwell         113     101      25    99*     2356    31.0   106.7
SJ McGlashan          92      89      18   131*     1979    27.9   113.4
JE Cameron           101      91      17    68*     1960    26.5   111.8
AE Satterthwaite      97      88      15    80*     1754    24.0    95.6
M Raj                 70      63      25    85*     1729    45.5    99.2
Highest averages (qual. 20 innings)
name                  mat    inns      no    hs      runs     avg      sr
KL Rolton              36      33      10    96*     1153    50.1   104.9
M Raj                  70      63      25    85*     1729    45.5    99.2
MD Thirush Kamini      24      23       5    63       783    43.5    85.7
FC Wilson              24      23       5    99       739    41.1   120.4
SR Taylor              58      56      11    90      1612    35.8   100.4
KV Jain                28      28      12    53*      569    35.6    79.2
M Kanojia              43      39      14    57*      849    34.0    80.6
CM Edwards            109     105      15    88      3043    33.8   112.7
SJ Taylor             101      95      18    77      2592    33.7   110.3
SFM Devine             63      61      14    99*     1571    33.4   121.0
Highest strike rates (qual. 20 innings with balls-faced recorded)
name            mat    inns      no    hs      runs     avg      sr
DJS Dottin       61      60      13   112*     1120    23.8   136.1
AC Smith         49      49       4    89      1049    23.3   127.1
SC Taylor        49      46      10    76*     1196    33.2   124.8
SFM Devine       63      61      14    99*     1571    33.4   121.0
FC Wilson        24      23       5    99       739    41.1   120.4
SE Rowe          47      32      12    67       647    32.4   119.0
LJ Poulton      101     100       9   103*     2692    29.6   117.7
MM Lanning       88      88      12    79      2455    32.3   116.9
SC King          52      48      11    81       672    18.2   116.6
AJ Healy         92      84      13    90      1554    21.9   116.5
Centuries
name          score for               against                             year     wtt
SJ McGlashan   131* Auckland          Northern Districts                  2014    1264
SA Fritz       116* South Africa      Netherlands                         2010     437
RA Birch       113* Devon             Dorset                              2013    1139
DJS Dottin     112* West Indies       South Africa                        2010     356
HC Knight      111  Berkshire         Devon                               2012     913
EL Marriott    109* Leicestershire    Oxfordshire                         2011     629
A Shrubsole    109* Somerset          Wales                               2013    1175
RH Priest      106* Central Districts Otago                               2012     812
HC Knight      106* Berkshire         Wales                               2012     891
MJ Bulow       103  Queensland        Tasmania                            2011     698
LJ Poulton     103* New South Wales   Australian Capital Territory        2011     720
DN Wyatt       102  Nottinghamshire   Yorkshire                           2013    1189
LM Keightley   101* Wiltshire         Buckinghamshire                     2010     375
DN Wyatt       100* Staffordshire     Lancashire                          2012     886
Leading wicket-takers
name            mat   balls    runs    wkts     bb      avg    econ
LC Sthalekar     99    2106    1908     110   5/11     17.3    5.44
HL Colvin        82    1771    1513      93    4/9     16.3    5.13
SEA Ruck        102    2121    1885      87    3/9     21.7    5.33
EA Perry         90    1869    1707      85   4/20     20.1    5.48
D Hazell         72    1647    1423      81   4/12     17.6    5.18
LR Doolan        91    1768    1732      80   4/10     21.7    5.88
S Nitschke       68    1450    1329      79   4/21     16.8    5.50
NJ Browne        91    1757    1544      77   4/15     20.1    5.27
SJ Coyte         71    1423    1430      74    4/5     19.3    6.03
EA Osborne       81    1627    1484      71   4/13     20.9    5.47
Lowest averages (qual. 20 wickets)
name                     mat   balls    runs    wkts     bb      avg    econ
J Turner                  18     373     246      27    4/8      9.1    3.96
A Maitra                  17     378     214      20    3/6     10.7    3.40
A Upendran                35     618     432      40   4/12     10.8    4.19
N Buley                   16     328     274      25   4/11     11.0    5.01
S Dabir                   32     680     527      46   4/13     11.5    4.65
S Asha                    24     540     394      34    4/7     11.6    4.38
A Kaur                    31     525     342      28    5/6     12.2    3.91
AN Davidson-Richards      26     408     378      30   4/13     12.6    5.56
P Jagtap                  24     505     346      27   3/11     12.8    4.11
M Chaudhary               23     486     310      24   3/11     12.9    3.83
Lowest economy rates (qual. 80 overs)
name                mat   balls    runs    wkts     bb      avg    econ
Shivangiraj Sin      25     550     349      18    2/1     19.4    3.81
M Chaudhary          23     486     310      24   3/11     12.9    3.83
A Kaur               31     525     342      28    5/6     12.2    3.91
SN Pradhan           32     535     357      20   3/30     17.9    4.00
P Jagtap             24     505     346      27   3/11     12.8    4.11
N David              33     696     477      27    4/8     17.7    4.11
P Dimri              25     570     392      30    3/9     13.1    4.13
J Goswami            60    1246     862      59   5/11     14.6    4.15
A Upendran           35     618     432      40   4/12     10.8    4.19
M Shalini            34     530     381      23    3/7     16.6    4.31
Five wickets in an innings
name              figures        for                           against                              year      wtt
DH Kaur           6/3            Punjab                        Jammu and Kashmir                     2009     281
NM Vijeylakshmi   6/7            Tamil Nadu                    Kerala                                2011     500
AE Satterthwaite  6/17           New Zealand                   England                               2007      25
H Swan            5/6            Hertfordshire                 Cambridgeshire and Huntingdonshire    2011     677
APC Kilowan       5/8            West Coast                    Central                               2008      58
Asmavia Iqbal     5/8            Pakistan                      Nottinghamshire                       2009     168
A Mohammed        5/10           West Indies                   South Africa                          2009     224
LC Sthalekar      5/11           New South Wales               Australian Capital Territory          2011     573
?                 5/14           Durham                        Cumbria                               2011     621
SW Bates          5/15           Otago                         Canterbury                            2011     560
P Roy             5/16           India                         Pakistan                              2009     177
KA Levick         5/16           Yorkshire                     Staffordshire                         2011     648
EAJ Richardson    5/17           Central Districts             Canterbury                            2011     502
CA Anneveld       5/22           Australian Capital Territory  South Australia                       2011     700
Highest team totals
team          opponent        total     year       wtt
Somerset      Wales           3/255     2013      1175
Ireland       Bedfordshire    1/218     2012       876
Derbyshire    Oxfordshire     0/207     2011       658
South Africa  Netherlands     1/205     2010       437
Staffordshire Lancashire      0/202     2012       886
Kent          Essex           8/199     2011       642
Berkshire     Wales           2/199     2013      1162
Kent          Surrey          3/198     2010       386
Maharashtra   Mumbai          3/194     2013      1084
Berkshire     Devon           5/192     2012       913
Saturday, April 14, 2012
Balls faced errors
A full re-score confirms Border’s runs and the sequence of strokes, yet the balls faced figures as published seem to be quite wrong. Border is given 314 balls for his 98* and 269 for the 100*. The figures I get are 283 and 285 balls, respectively. Viv Richards’ figures for his 76 are also very doubtful: I get 130 balls not 188. There are other discrepancies. Using the revised figures, the balls faced now reconcile with the bowling figures.
I had never thought to compare the balls faced with the total overs in an innings. I was surprised to find that substantial disagreements are quite common. Some discrepancies are to be expected – a single off a no-ball used to be an extra ball but not a sundry; many wides can come from one ball; a wide used to be counted as a ball faced in Australia; there have been plenty of 5- and 7-ball overs which won't show up in the team totals.
But still. Below is a list of innings where the discrepancy is at least 20 balls. It's enormous. I've defined "discrepancy" as the sum of the balls faced, minus the total number of balls in the innings, minus the extras. I had originally planned to manually check all of these anomalies, but I couldn't be bothered. I've made notes on a few of the more egregious cases.
I didn't output the dates of the Tests when making this table. The quickest way to pull up the scorecard is probably via CricketArchive's Scorecard Oracle. To bring up Test 104, enter t104 as the 'match id'. The Test that Davis talked about is t983 – you can see that all three innings of that match are on the list, as are two innings from the fourth Test of that series.
The following list is based on the CricketArchive scorecards as they were a few years ago. Probably some errors have been ironed out since. (I've also omitted one scorecard which had obviously flipped the balls-faced and minutes; hopefully it will be corrected in the coming days.)
Test no.  Home           Away           inns   sum BF inns balls   nb   wd discrepancy
104       England        Australia          4     310        330    0    0          20
180       Australia      England            4     832        805    0    0          27
290       Australia      India              3     368        399    1    0          32
303       England        Australia          1     277        253    0    0          24
470       New Zealand    England            2     377        437    0    0          60 Judging by the minutes,
                                                                                       I think Bolton faced ~60
                                                                                       more balls than is given
537       Australia      England            1     715        693    0    2          20
598       Australia      England            1     883        861    1    0          21
613       South Africa   Australia          2     736        763    0    0          27
628       Australia      India              4     618        590    0    0          28
673       South Africa   Australia          3     779        728   20    0          31
703       India          England            1     458        508    0    0          50 Minutes make sense.
                                                                                       Probably Venkat faced more.
708       India          England            3     522        636    3    0         117 Minutes make sense.
                                                                                       Probably Denness faced more.
730       Australia      New Zealand        3     740        717    2    0          21
731       West Indies    England            2     798        736   16    0          46
748       Australia      England            3     645        729   11    1          96 Wisden says Titmus batted for
                                                                                       200 minutes, not 108; probably
                                                                                       faced a lot more.  Old too?
757       New Zealand    England            3     401        461   12    0          72
835       India          West Indies        1     812        822   13    0          23
835       India          West Indies        2     928        966    8    0          46
855       India          Australia          2     831        783   23    0          25
855       India          Australia          3     657        682    3    0          28
858       India          Australia          1     932        866   24    0          42
858       India          Australia          2     628        639   19    0          30
859       India          Australia          2     787        754    8    4          21
863       India          Pakistan           1     593        551    4    0          38
865       India          Pakistan           3     399        419    5    0          25
869       India          Pakistan           3     441        400   17    0          24
876       Pakistan       Australia          2     664        713   10    0          59
876       Pakistan       Australia          3     521        540    2    1          22
878       Pakistan       Australia          1    1302       1266    3    0          33
878       Pakistan       Australia          2     724        756   15    0          47
889       Australia      New Zealand        3     316        289    5    2          20
891       Australia      New Zealand        1     799        729    6    3          61
908       England        Australia          3     658        626    7    1          24
914       India          England            2     955        961   21    4          31
918       India          England            2     917        935   12    0          30
922       New Zealand    Australia          1     762        696   11    4          51
924       New Zealand    Australia          4     138        178    0    0          40
937       Pakistan       Australia          3     494        540    8    0          54
970       Australia      Pakistan           1     722        734    4    4          20
983       West Indies    Australia          1     605        553   17    0          35
983       West Indies    Australia          2     815        756    1    2          56
983       West Indies    Australia          3     634        673   14    1          54
985       Sri Lanka      New Zealand        2    1079       1050    6    2          21
987       West Indies    Australia          1     563        581   10    0          28
987       West Indies    Australia          2     850        874    1    0          25
993       England        West Indies        3     639        579    0    0          60
998       Pakistan       New Zealand        1     392        448    0    0          56
998       Pakistan       New Zealand        2     530        560    2    0          32
998       Pakistan       New Zealand        3     441        498    4    1          62
998       Pakistan       New Zealand        4     347        391    0    0          44
1000      Pakistan       New Zealand        1     674        651    1    0          22
1000      Pakistan       New Zealand        3     378        337    3    0          38
1010      New Zealand    Pakistan           2    1002        882    6    0         114 Probably Wright faced a lot less.
1033      Australia      India              2     930        890   17    0          23
1045      West Indies    England            2     635        646   40    0          51
1052      India          Australia          2     600        566    6    0          28
1052      India          Australia          3     273        294    1    0          22
1058      Pakistan       West Indies        2     566        661    2    1          98 Rameez faced much more.
1065      Australia      England            2     598        564    2    2          30
1072      New Zealand    West Indies        3     382        423    8    0          49
1087      Australia      New Zealand        4     577        552    4    0          21
1097      West Indies    Pakistan           3     546        563   14    0          31
1118      West Indies    India              1     618        632   22    0          36
1118      West Indies    India              2     667        671   22    0          26
1118      West Indies    India              3     543        585   13    0          55
1118      West Indies    India              4     271        288    3    0          20
1152      Pakistan       New Zealand        2     782        750   12    0          20
1163      Australia      England            1     509        400    5    1         103 Atherton faced much less.
1170      West Indies    Australia          3     584        547    4    0          33
1180      Australia      India              2     836        732   11    0          93 Probably Jones faced much less.
1186      Australia      India              3     719        681    6    0          32
1195      Sri Lanka      Australia          3     715        690    5    0          20
1220      West Indies    Pakistan           1     222        230   11    2          21
1232      Sri Lanka      South Africa       4     592        672   15    1          96 Probably Rhodes faced much more.
1237      Pakistan       Zimbabwe           1     903        930    1    0          28
1238      Australia      New Zealand        1     608        633    2    0          27
1239      Sri Lanka      West Indies        3     102        133    1    0          32
1247      India          Sri Lanka          1     350        383    0    0          33
1247      India          Sri Lanka          3     608        627    1    0          20
1262      England        New Zealand        1     855        879    2    1          27
1266      England        South Africa       1     543        554   18    1          30
1268      Pakistan       Australia          2     558        523    4    0          31
1278      India          West Indies        1     855        856   14    5          20
1278      India          West Indies        2     767        771   17    1          22
1282      South Africa   New Zealand        3     643        667    6    1          31
1291      New Zealand    South Africa       1     663        633    0    0          30
1293      New Zealand    Sri Lanka          2     887        834   15    0          38
1325      West Indies    New Zealand        1     369        372   17    1          21
1325      West Indies    New Zealand        2     949        987   12    0          50
1415      Sri Lanka      New Zealand        1     665        632    9    1          23
Friday, March 30, 2012
On the batting h-index
The definition of h-index is this: it is the largest integer h such that the batsman has made h scores of at least h. Combining Test and ODI cricket, Sachin Tendulkar has an h-index of 100, since he's made 100 scores of at least 100.
Kartikeya correctly notes that a batsman's h-index will tend to rise over the course of his career, and it can never decrease – if after 30 innings, he has 12 scores of at least 12, then he will never again have less than 12 scores of at least 12. The question then arises as to how to normalise the h-index, and Kartikeya proposes h^2 / innings, which "is a measure of consistency and quality without either privileging or penalizing a player for length of career".
I was initially very sceptical that such a normalisation could work. But it does, somehow. I'll split this post into two parts: in the first, I'll talk about why h^2 / innings is a decent metric over a range of different career lengths; in the second, I'll describe what I would do with an h-index, and show that my method doesn't give much (if any) improvement on h^2 / innings.
h^2 / innings
For ease of doing the maths, let's assume that a batsman's scores are exponentially distributed, so that the probability of a score greater than n is exp(-n / avg). This assumption is not particularly good for low scores, but it'll do for now.
For a career of N innings, the expectation value is for N * exp(-n / avg) scores of above n. Now we can write an equation to define what this idealised batsman's h-index will be:
N * exp(-h / avg) = h.
This sort of equation doesn't have a solution in terms of elementary functions, but it does using the ProductLog function that you can use in Wolfram Alpha. In any case, if you hold avg constant, and write h as a function of career length N, and square h, then this is the graph that you get:

That is remarkably close to a straight line. I don't know whether there's a good mathematical reason why it should be so close to linear, or whether it's just a coincidence. In any case, it shows that dividing h^2 by the number of innings will give you something roughly constant over a career, assuming an idealised batsman with constant ability.
It can't always be near-linear though. Obviously someone who's only batted in one innings can have an h-index of at most 1, and then h^2 / innings will also be 1. So early in a career, this won't be a reliable measure (though it does have the possibly desirable feature of preventing someone with an excellent start to his career showing up near the top of the all-time list after 20 innings). This is clearer if we plot h^2 / innings against innings, done here for an idealised batsman who averages 40:

There are two points to make here. The first is that for career lengths between about 50 innings and 300 innings, h^2 / innings doesn't vary too much: its maximum in this case is at about 14.7, its minimum over that range about 13. The second point is that this level of variability may be undesirable. An increase of 1.5 in h^2 / innings could send someone from being ranked 50th all-time to being ranked 23rd.
What I would do with the h-index
So let's instead go back to that equation, and solve instead for avg. This is straightforward:
avg = h / ln(N/h).
Essentially, then, for a given number of innings N, we are associating an h-index with some sort of effective average, which I'll call an h-average (it won't be defined if h = N). I think it's useful to do this, because the h-average is on the same scale as the regular average, which we're all familiar with. An h-average of 50 is very high; Chris Martin has an h-average of 1.8 (or at least he did whenever I last updated my database, in December 2010). A table of h- and regular averages is at the end of this post.
I expected that, for batsmen with 50 or more Test innings, the h-average would give a nicer all-time ranking than h^2 / innings. But while there was a bit of shuffling, overall the two measures are very closely correlated:

It is interesting to see how these h measures correlate with the regular batting average. Relaxing the qualification to just 20 Test innings, here are the two scatterplots (first the h-average, then h^2 / innings):


The wild non-Bradman outlier on the first plot is Jesse Ryder, who at the time of my last database update had an h-index of 20 after just 25 innings. In the second scatterplot, you can see that his (and a bunch of other high-h-average players) h^2 / innings is suppressed because of his low number of innings. But correlations are quite good – given a player's average, his h-average doesn't tell you that much extra information about his batting, and vice versa.
I don't think I have a strong conclusion. The h-index rewards consistent scoring, and while consistency may be useful, I'm not sure that it's better or worse than scoring the same amount of total runs but with less consistency.
(Edit 1 April: I ignored not-outs, because they're annoying. You get slightly better agreement between the h-average and runs-per-innings than between the h-average and the regular average.)
Anyway, here is a nice big table. Qualification of 50 Test innings; stats current to late 2010.
name mat inns no runs h avg h^2/inns h-avg
DG Bradman 52 80 10 6996 44 99.9 24.2 73.6
JB Hobbs 61 102 7 5410 47 56.9 21.7 60.7
KF Barrington 82 131 15 6806 53 58.7 21.4 58.6
H Sutcliffe 54 84 9 4555 41 60.7 20.0 57.2
IVA Richards 121 182 12 8540 60 50.2 19.8 54.1
SR Tendulkar 174 284 30 14366 73 56.6 18.8 53.7
ED Weekes 48 81 5 4455 39 58.6 18.8 53.4
L Hutton 79 138 15 6971 52 56.7 19.6 53.3
SM Gavaskar 125 214 16 10122 63 51.1 18.5 51.5
KC Sangakkara 94 156 12 8244 54 57.3 18.7 50.9
RS Dravid 146 251 29 11920 67 53.7 17.9 50.7
RT Ponting 149 253 28 12220 67 54.3 17.7 50.4
SM Katich 55 97 6 4186 42 46.0 18.2 50.2
KD Walters 74 125 14 5357 48 48.3 18.4 50.2
BC Lara 130 230 6 11912 64 53.2 17.8 50.0
CL Walcott 44 74 7 3798 36 56.7 17.5 50.0
JH Kallis 141 239 35 11366 65 55.7 17.7 49.9
Mohammad Yousuf 90 156 12 7530 53 52.3 18.0 49.1
GS Chappell 87 151 19 7110 52 53.9 17.9 48.8
EH Hendren 51 83 9 3525 38 47.6 17.4 48.6
AD Nourse 34 62 7 2960 32 53.8 16.5 48.4
JB Stollmeyer 32 56 5 2159 30 42.3 16.1 48.1
AL Hassett 43 69 3 3073 34 46.6 16.8 48.0
B Mitchell 42 80 9 3471 37 48.9 17.1 48.0
S Chanderpaul 129 219 34 9063 61 49.0 17.0 47.7
DPMD Jayawardene 116 190 13 9527 57 53.8 17.1 47.3
Inzamam-ul-Haq 119 198 22 8829 58 50.2 17.0 47.2
HM Amla 48 85 7 3647 38 46.8 17.0 47.2
A Flower 63 112 19 4794 44 51.5 17.3 47.1
EJ Barlow 30 57 2 2516 30 45.7 15.8 46.7
CC Hunte 44 78 6 3245 36 45.1 16.6 46.6
GS Sobers 93 160 21 8032 52 57.8 16.9 46.3
Javed Miandad 124 189 21 8832 56 52.6 16.6 46.0
Saeed Anwar 55 91 2 4052 39 45.5 16.7 46.0
IR Redpath 66 120 11 4737 45 43.5 16.9 45.9
SR Waugh 168 260 46 10927 64 51.1 15.8 45.7
VVS Laxman 117 192 30 7707 56 47.6 16.3 45.4
Younis Khan 65 116 8 5440 44 50.4 16.7 45.4
G Boycott 108 193 23 8114 56 47.7 16.2 45.3
MH Richardson 38 65 3 2776 32 44.8 15.8 45.2
MEK Hussey 56 97 12 4420 40 52.0 16.5 45.2
AR Border 156 265 44 11174 64 50.6 15.5 45.0
ER Dexter 62 102 8 4502 41 47.9 16.5 45.0
GC Smith 87 152 9 7302 50 51.1 16.4 45.0
MC Cowdrey 114 188 15 7624 55 44.1 16.1 44.7
SJ McCabe 39 62 5 2748 31 48.2 15.5 44.7
ML Hayden 102 182 14 8437 54 50.2 16.0 44.4
CH Lloyd 110 175 14 7515 53 46.7 16.1 44.4
V Sehwag 83 142 6 7467 48 54.9 16.2 44.3
RC Fredericks 59 109 7 4334 42 42.5 16.2 44.0
DCS Compton 78 131 15 5807 46 50.1 16.2 44.0
ME Waugh 128 209 17 8029 57 41.8 15.5 43.9
AH Jones 39 74 8 2922 34 44.3 15.6 43.7
NS Sidhu 51 78 2 3202 35 42.1 15.7 43.7
MA Taylor 104 186 13 7525 54 43.5 15.7 43.7
AN Cook 62 111 7 4814 42 46.3 15.9 43.2
PBH May 66 106 9 4537 41 46.8 15.9 43.2
WR Hammond 85 140 16 7249 47 58.5 15.8 43.1
AR Morris 46 79 3 3533 35 46.5 15.5 43.0
RA Smith 62 112 15 4236 42 43.7 15.8 42.8
WM Lawry 67 123 12 5234 44 47.2 15.7 42.8
AC Gilchrist 95 135 20 5475 46 47.6 15.7 42.7
G Kirsten 101 176 15 7289 52 45.3 15.4 42.6
GR Viswanath 91 155 10 6080 49 41.9 15.5 42.5
AW Greig 58 93 4 3599 38 40.4 15.5 42.5
M Amarnath 69 113 10 4378 42 42.5 15.6 42.4
AB de Villiers 63 108 13 4540 41 47.8 15.6 42.3
TT Samaraweera 63 98 17 4395 39 54.3 15.5 42.3
KP Pietersen 68 119 6 5576 43 49.3 15.5 42.2
GP Thorpe 100 179 28 6744 52 44.7 15.1 42.1
DI Gower 117 204 18 8231 55 44.3 14.8 42.0
DR Martyn 67 109 14 4406 41 46.4 15.4 41.9
M Leyland 41 65 5 2764 31 46.1 14.8 41.9
NC O'Neill 42 69 8 2779 32 45.6 14.8 41.6
GA Gooch 118 215 6 8900 56 42.6 14.6 41.6
GM Turner 41 73 6 2991 33 44.6 14.9 41.6
RR Sarwan 83 146 8 5759 47 41.7 15.1 41.5
M Azharuddin 99 147 9 6215 47 45.0 15.0 41.2
RB Simpson 62 111 7 4869 41 46.8 15.1 41.2
MJ Clarke 65 106 12 4596 40 48.9 15.1 41.0
Majid Khan 63 106 5 3931 40 38.9 15.1 41.0
C Washbrook 37 66 6 2569 31 42.8 14.6 41.0
CG Greenidge 108 185 16 7558 52 44.7 14.6 41.0
Saeed Ahmed 41 78 4 2991 34 40.4 14.8 40.9
BF Butcher 44 78 6 3104 34 43.1 14.8 40.9
DL Haynes 116 202 25 7487 54 42.3 14.4 40.9
MA Atherton 115 212 7 7728 55 37.7 14.3 40.8
IR Bell 59 102 11 4007 39 44.0 14.9 40.6
ME Trescothick 76 143 10 5825 46 43.8 14.8 40.6
JL Langer 104 180 12 7674 51 45.7 14.5 40.4
RN Harvey 79 137 10 6149 45 48.4 14.8 40.4
RB Kanhai 79 137 6 6227 45 47.5 14.8 40.4
PE Richardson 34 56 1 2061 28 37.5 14.0 40.4
SP Fleming 111 189 10 7172 52 40.1 14.3 40.3
KC Wessels 40 71 3 2788 32 41.0 14.4 40.2
AI Kallicharran 66 109 10 4399 40 44.4 14.7 39.9
RB Richardson 86 146 12 5949 46 44.4 14.5 39.8
Taufeeq Umar 27 50 2 1866 26 38.9 13.5 39.8
DJ Cullinan 70 115 12 4554 41 44.2 14.6 39.8
HH Gibbs 90 154 7 6167 47 42.0 14.3 39.6
G Gambhir 36 64 5 2992 30 50.7 14.1 39.6
DB Vengsarkar 116 185 22 6868 51 42.1 14.1 39.6
WJ Cronje 68 111 9 3714 40 36.4 14.4 39.2
SC Ganguly 113 188 17 7212 51 42.2 13.8 39.1
SV Manjrekar 37 61 6 2043 29 37.1 13.8 39.0
WM Woodfull 35 54 4 2300 27 46.0 13.5 39.0
MS Dhoni 51 77 9 2746 33 40.4 14.1 38.9
AJ Strauss 79 143 6 5888 45 43.0 14.2 38.9
DC Boon 107 190 20 7422 51 43.7 13.7 38.8
MJ Slater 74 131 7 5312 43 42.8 14.1 38.6
CH Gayle 91 159 6 6374 47 41.7 13.9 38.6
FMM Worrell 51 87 9 3860 35 49.5 14.1 38.4
TL Goddard 41 78 5 2516 33 34.5 14.0 38.4
CC McDonald 47 83 4 3107 34 39.3 13.9 38.1
BL D'Oliveira 44 70 8 2484 31 40.1 13.7 38.1
JH Edrich 77 127 9 5138 42 43.5 13.9 38.0
A Ranatunga 93 155 12 5105 46 35.7 13.7 37.9
Mohsin Khan 48 79 6 2709 33 37.1 13.8 37.8
N Hussain 96 171 16 5764 48 37.2 13.5 37.8
VS Hazare 30 52 6 2192 26 47.7 13.0 37.5
KD Mackay 37 52 7 1507 26 33.5 13.0 37.5
IM Chappell 75 136 10 5345 43 42.4 13.6 37.3
TW Graveney 79 123 13 4882 41 44.4 13.7 37.3
HW Taylor 42 76 4 2936 32 40.8 13.5 37.0
B Sutcliffe 42 76 8 2727 32 40.1 13.5 37.0
MD Crowe 77 131 11 5444 42 45.4 13.5 36.9
AJ Stewart 133 235 21 8463 54 39.5 12.4 36.7
Shoaib Mohammad 45 68 7 2705 30 44.3 13.2 36.7
JM Parks 46 68 7 1962 30 32.2 13.2 36.7
CPS Chauhan 40 68 2 2084 30 31.6 13.2 36.7
Saleem Malik 103 154 22 5768 45 43.7 13.1 36.6
EAB Rowan 26 50 5 1965 25 43.7 12.5 36.1
FE Woolley 64 98 7 3283 36 36.1 13.2 35.9
SM Nurse 29 54 1 2523 26 47.6 12.5 35.6
NJ Astle 81 137 10 4702 42 37.0 12.9 35.5
PD Collingwood 65 111 10 4222 38 41.8 13.0 35.4
Rameez Raja 57 94 5 2833 35 31.8 13.0 35.4
ND McKenzie 58 94 7 3253 35 37.4 13.0 35.4
GN Yallop 39 70 3 2756 30 41.1 12.9 35.4
Zaheer Abbas 78 124 11 5062 40 44.8 12.9 35.4
KJ Hughes 70 124 6 4415 40 37.4 12.9 35.4
DM Jones 52 89 11 3631 34 46.6 13.0 35.3
Mushtaq Mohammad 57 100 7 3643 36 39.2 13.0 35.2
ST Jayasuriya 110 188 14 6973 48 40.1 12.3 35.2
LRPL Taylor 28 51 1 2077 25 41.5 12.3 35.1
MP Vaughan 82 147 9 5719 43 41.4 12.6 35.0
JG Wright 82 148 7 5334 43 37.8 12.5 34.8
CG Macartney 35 55 4 2131 26 41.8 12.3 34.7
JR Reid 58 108 5 3428 37 33.3 12.7 34.5
WJ Edrich 39 63 2 2440 28 40.0 12.4 34.5
Hanif Mohammad 55 97 8 3915 35 44.0 12.6 34.3
PA de Silva 93 159 11 6361 44 43.0 12.2 34.2
PH Parfitt 37 52 6 1882 25 40.9 12.0 34.1
KR Miller 55 87 7 2958 33 37.0 12.5 34.0
DJ McGlew 34 64 6 2440 28 42.1 12.3 33.9
HP Tillakaratne 83 131 25 4545 40 42.9 12.2 33.7
MA Butcher 71 131 7 4288 40 34.6 12.2 33.7
Asif Iqbal 58 99 7 3575 35 38.9 12.4 33.7
TM Dilshan 66 105 11 3990 36 42.4 12.3 33.6
AL Logie 52 78 9 2470 31 35.8 12.3 33.6
Aamer Sohail 47 83 3 2823 32 35.3 12.3 33.6
Nawab of Pataudi 46 83 3 2793 32 34.9 12.3 33.6
PR Umrigar 59 94 8 3631 34 42.2 12.3 33.4
CL Hooper 102 173 15 5762 45 36.5 11.7 33.4
GRJ Matthews 33 53 8 1849 25 41.1 11.8 33.3
AP Sheahan 31 53 6 1594 25 33.9 11.8 33.3
C Hill 49 89 2 3412 33 39.2 12.2 33.3
Sadiq Mohammad 41 74 2 2579 30 35.8 12.2 33.2
WW Armstrong 50 84 10 2863 32 38.7 12.2 33.2
MJ Prior 37 57 11 1923 26 41.8 11.9 33.1
AP Gurusinha 41 70 7 2452 29 38.9 12.0 32.9
KWR Fletcher 59 96 14 3272 34 39.9 12.0 32.8
JN Rhodes 52 80 9 2532 31 35.7 12.0 32.7
W Bardsley 41 66 5 2469 28 40.5 11.9 32.7
HA Gomes 60 91 11 3171 33 39.6 12.0 32.5
Shoaib Malik 32 54 6 1606 25 33.5 11.6 32.5
DJ Bravo 40 71 1 2200 29 31.4 11.8 32.4
VL Manjrekar 55 92 10 3208 33 39.1 11.8 32.2
CL Cairns 62 104 5 3320 35 33.5 11.8 32.1
AJ Lamb 79 139 10 4656 40 36.1 11.5 32.1
FM Engineer 46 87 3 2611 32 31.1 11.8 32.0
AC Hudson 35 63 3 2007 27 33.5 11.6 31.9
APE Knott 95 149 15 4389 41 32.8 11.3 31.8
DN Sardesai 30 55 4 2001 25 39.2 11.4 31.7
PJP Burge 42 68 8 2290 28 38.2 11.5 31.6
AG Prince 59 94 15 3435 33 43.5 11.6 31.5
GP Howarth 47 83 5 2531 31 32.4 11.6 31.5
MA Noble 42 73 7 1997 29 30.3 11.5 31.4
MJK Smith 50 78 6 2278 30 31.6 11.5 31.4
A Flintoff 78 128 9 3795 38 31.9 11.3 31.3
BE Congdon 61 114 7 3448 36 32.2 11.4 31.2
TW Hayward 35 60 2 1999 26 34.5 11.3 31.1
MW Tate 39 52 5 1198 24 25.5 11.1 31.0
NJ Contractor 31 52 1 1611 24 31.6 11.1 31.0
MW Gatting 79 138 14 4409 39 35.6 11.0 30.9
DL Vettori 102 155 22 4045 41 30.4 10.8 30.8
MJ Horne 35 65 2 1788 27 28.4 11.2 30.7
CD McMillan 55 91 10 3116 32 38.5 11.3 30.6
CG Borde 55 97 11 3061 33 35.6 11.2 30.6
KR Stackpole 43 80 5 2807 30 37.4 11.3 30.6
Imran Farhat 39 75 2 2327 29 31.9 11.2 30.5
MG Burgess 50 92 6 2684 32 31.2 11.1 30.3
Wasim Raja 57 92 14 2821 32 36.2 11.1 30.3
GM Ritchie 30 53 5 1690 24 35.2 10.9 30.3
SV Carlisle 37 66 6 1615 27 26.9 11.0 30.2
ML Jaisimha 39 71 4 2056 28 30.7 11.0 30.1
AL Wadekar 37 71 3 2113 28 31.1 11.0 30.1
MV Boucher 135 190 22 5223 44 31.1 10.2 30.1
Habibul Bashar 50 99 1 3026 33 30.9 11.0 30.0
IT Botham 102 161 6 5200 41 33.5 10.4 30.0
BM McMillan 38 62 12 1968 26 39.4 10.9 29.9
HH Dippenaar 38 62 5 1718 26 30.1 10.9 29.9
Salman Butt 33 62 0 1889 26 30.5 10.9 29.9
DL Amiss 50 88 10 3612 31 46.3 10.9 29.7
M Prabhakar 39 58 9 1600 25 32.7 10.8 29.7
GT Dowling 39 77 3 2306 29 31.2 10.9 29.7
RJ Shastri 80 121 14 3830 36 35.8 10.7 29.7
GA Hick 65 114 6 3383 35 31.3 10.7 29.6
Kapil Dev 131 184 15 5248 43 31.1 10.0 29.6
AW Nourse 45 83 8 2234 30 29.8 10.8 29.5
VT Trumper 48 89 8 3163 31 39.0 10.8 29.4
MS Atapattu 90 156 15 5502 40 39.0 10.3 29.4
JA Rudolph 35 63 7 2028 26 36.2 10.7 29.4
GW Flower 67 123 6 3457 36 29.5 10.5 29.3
BA Young 35 68 4 2034 27 31.8 10.7 29.2
Mudassar Nazar 76 116 8 4114 35 38.1 10.6 29.2
GS Blewett 46 79 4 2552 29 34.0 10.6 28.9
P Roy 43 79 4 2442 29 32.6 10.6 28.9
RES Wyatt 40 64 6 1839 26 31.7 10.6 28.9
JV Coney 52 85 14 2668 30 37.6 10.6 28.8
WW Hinds 45 80 1 2608 29 33.0 10.5 28.6
GM Wood 59 112 6 3374 34 31.8 10.3 28.5
Ijaz Ahmed 60 92 4 3315 31 37.7 10.4 28.5
JHB Waite 50 86 7 2405 30 30.4 10.5 28.5
AD Gaekwad 40 70 4 1985 27 30.1 10.4 28.3
CJ Tavaré 31 56 2 1755 24 32.5 10.3 28.3
GR Marsh 50 93 7 2854 31 33.2 10.3 28.2
SL Campbell 52 93 4 2882 31 32.4 10.3 28.2
BB McCullum 55 93 6 3232 31 37.1 10.3 28.2
Yuvraj Singh 34 52 6 1639 23 35.6 10.2 28.2
WR Endean 28 52 4 1630 23 34.0 10.2 28.2
AC MacLaren 35 61 4 1931 25 33.9 10.2 28.0
JP Crawley 37 61 9 1800 25 34.6 10.2 28.0
MJ Greatbatch 41 71 5 2021 27 30.6 10.3 27.9
RW Marsh 96 150 13 3633 38 26.5 9.6 27.7
ADR Campbell 60 109 4 2858 33 27.2 10.0 27.6
LEG Ames 47 72 12 2434 27 40.6 10.1 27.5
Imran Khan 88 126 25 3807 35 37.7 9.7 27.3
JC Adams 54 90 17 3012 30 41.3 10.0 27.3
J Dyson 30 58 7 1359 24 26.6 9.9 27.2
BA Edgar 39 68 4 1958 26 30.6 9.9 27.0
SM Pollock 108 156 39 3781 38 32.3 9.3 26.9
KG Viljoen 27 50 2 1365 22 28.4 9.7 26.8
Kamran Akmal 53 92 6 2648 30 30.8 9.8 26.8
JDP Oram 33 59 10 1780 24 36.3 9.8 26.7
Yashpal Sharma 37 59 11 1606 24 33.5 9.8 26.7
RP Arnold 44 69 4 1821 26 28.0 9.8 26.6
PJL Dujon 81 115 11 3322 33 31.9 9.5 26.4
IA Healy 119 182 23 4356 40 27.4 8.8 26.4
GJ Whittall 46 82 7 2207 28 29.4 9.6 26.1
RS Mahanama 52 89 1 2576 29 29.3 9.4 25.9
MS Sinclair 33 56 5 1635 23 32.1 9.4 25.8
DS Smith 32 56 2 1370 23 25.4 9.4 25.8
K Srikkanth 43 72 3 2062 26 29.9 9.4 25.5
Imtiaz Ahmed 41 72 1 2079 26 29.3 9.4 25.5
RS Kaluwitharana 49 78 4 1933 27 26.1 9.3 25.5
TE Bailey 61 91 14 2290 29 29.7 9.2 25.4
Rashid Latif 37 57 9 1381 23 28.8 9.3 25.3
RA McLean 40 73 3 2120 26 30.3 9.3 25.2
MR Ramprakash 52 92 6 2350 29 27.3 9.1 25.1
GO Jones 34 53 4 1172 22 23.9 9.1 25.0
G Giffen 31 53 0 1238 22 23.4 9.1 25.0
RC Russell 54 86 16 1897 28 27.1 9.1 25.0
SMH Kirmani 88 124 22 2759 33 27.0 8.8 24.9
W Jaffer 31 58 1 1944 23 34.1 9.1 24.9
L Klusener 49 69 11 1906 25 32.9 9.1 24.6
AC Parore 78 128 19 2865 33 26.3 8.5 24.3
Moin Khan 69 104 8 2741 30 28.6 8.7 24.1
JT Tyldesley 31 55 1 1661 22 30.8 8.8 24.0
J Darling 34 60 2 1657 23 28.6 8.8 24.0
W Rhodes 58 98 21 2325 29 30.2 8.6 23.8
CC Lewis 32 51 3 1105 21 23.0 8.6 23.7
G Miller 34 51 4 1213 21 25.8 8.6 23.7
KR Rutherford 56 99 8 2465 29 27.1 8.5 23.6
SE Gregory 58 100 7 2282 29 24.5 8.4 23.4
D Ramdin 42 73 8 1482 25 22.8 8.6 23.3
N Boje 43 62 10 1312 23 25.2 8.5 23.2
SC Williams 31 52 3 1183 21 24.1 8.5 23.2
Javed Omar 40 80 2 1720 26 22.1 8.5 23.1
MN Samuels 29 53 4 1408 21 28.7 8.3 22.7
GS Ramchand 33 53 5 1180 21 24.6 8.3 22.7
R Benaud 63 97 7 2201 28 24.5 8.1 22.5
KS More 49 64 14 1285 23 25.7 8.3 22.5
R Illingworth 61 90 11 1836 27 23.2 8.1 22.4
Abdur Razzaq 46 77 9 1946 25 28.6 8.1 22.2
JJ Crowe 39 65 4 1601 23 26.2 8.1 22.1
KLT Arthurton 33 50 5 1382 20 30.7 8.0 21.8
SA Durani 29 50 2 1202 20 25.0 8.0 21.8
D Ganga 48 86 2 2160 26 25.7 7.9 21.7
DW Randall 47 79 5 2470 25 33.4 7.9 21.7
AK Davidson 44 61 7 1328 22 24.6 7.9 21.6
RG Nadkarni 41 67 12 1414 23 25.7 7.9 21.5
WAS Oldfield 54 80 17 1427 25 22.7 7.8 21.5
RD Jacobs 65 112 21 2577 29 28.3 7.5 21.5
BF Hastings 31 56 6 1510 21 30.2 7.9 21.4
IDS Smith 63 88 17 1815 26 25.6 7.7 21.3
DL Murray 62 96 9 1993 27 22.9 7.6 21.3
RJ Hadlee 86 134 19 3124 31 27.2 7.2 21.2
Wasim Akram 104 147 19 2898 32 22.6 7.0 21.0
JM Parker 36 63 2 1498 22 24.6 7.7 20.9
WPUJC Vaas 111 162 35 3089 33 24.3 6.7 20.7
DJ Richardson 42 64 8 1359 22 24.3 7.6 20.6
S Abid Ali 29 53 3 1018 20 20.4 7.5 20.5
V Pollard 32 59 7 1266 21 24.3 7.5 20.3
MH Mankad 44 72 5 2109 23 31.5 7.3 20.2
B Yardley 33 54 4 978 20 19.6 7.4 20.1
MG Johnson 39 54 8 1030 20 22.4 7.4 20.1
JM Brearley 39 66 3 1442 22 22.9 7.3 20.0
JE Emburey 64 96 20 1713 26 22.5 7.0 19.9
DD Ebrahim 29 55 1 1226 20 22.7 7.3 19.8
AF Giles 54 81 13 1421 24 20.9 7.1 19.7
P Willey 26 50 6 1184 19 26.9 7.2 19.6
PR Reiffel 35 50 14 955 19 26.5 7.2 19.6
C White 30 50 7 1052 19 24.5 7.2 19.6
CB Wishart 27 50 1 1098 19 22.4 7.2 19.6
NR Mongia 44 68 8 1442 22 24.0 7.1 19.5
DG Cork 37 56 8 864 20 18.0 7.1 19.4
HDPK Dharmasena 31 51 7 868 19 19.7 7.1 19.2
KJ Wadsworth 33 51 4 1010 19 21.5 7.1 19.2
AFA Lilley 35 52 8 903 19 20.5 6.9 18.9
SK Warne 144 197 17 3142 33 17.5 5.5 18.5
Mohammad Ashraful 55 107 4 2306 26 22.4 6.3 18.4
JG Bracewell 41 60 11 1001 20 20.4 6.7 18.2
TG Evans 91 133 14 2439 28 20.5 5.9 18.0
Khaled Mashud 44 84 10 1409 23 19.0 6.3 17.8
RR Lindwall 61 84 13 1502 23 21.2 6.3 17.8
Madan Lal 39 62 16 1042 20 22.7 6.5 17.7
BR Taylor 30 50 6 898 18 20.4 6.5 17.6
MG Hughes 53 70 8 1032 21 16.6 6.3 17.4
MD Marshall 81 107 11 1810 25 18.9 5.8 17.2
HH Streak 65 107 18 1990 25 22.4 5.8 17.2
B Lee 75 88 18 1447 23 20.7 6.0 17.1
DN Patel 37 66 8 1200 20 20.7 6.1 16.8
HJ Tayfield 37 60 9 862 19 16.9 6.0 16.5
FJ Titmus 53 76 11 1449 21 22.3 5.8 16.3
Intikhab Alam 47 77 10 1493 21 22.3 5.7 16.2
Mohammad Rafique 33 63 6 1059 19 18.6 5.7 15.9
AC Bannerman 28 50 2 1108 17 23.1 5.8 15.8
J Briggs 33 50 5 815 17 18.1 5.8 15.8
KD Ghavri 39 57 14 913 18 21.2 5.7 15.6
Sarfraz Nawaz 55 72 13 1045 20 17.7 5.6 15.6
Harbhajan Singh 90 124 21 1915 25 18.6 5.0 15.6
DA Allen 39 51 15 918 17 25.5 5.7 15.5
BL Cairns 43 65 8 928 19 16.3 5.6 15.4
A Kumble 132 173 32 2506 28 17.8 4.5 15.4
RW Taylor 57 83 12 1156 21 16.3 5.3 15.3
WW Hall 48 66 14 818 19 15.7 5.5 15.3
H Trumble 32 57 14 851 17 19.8 5.1 14.1
SB Doull 32 50 11 570 16 14.6 5.1 14.0
PH Edmonds 51 65 15 875 18 17.5 5.0 14.0
IWG Johnson 45 66 12 1000 18 18.5 4.9 13.9
FS Trueman 67 85 14 981 20 13.8 4.7 13.8
ATW Grout 51 67 8 890 18 15.1 4.8 13.7
JM Blackham 35 62 11 800 17 15.7 4.7 13.1
AME Roberts 47 62 11 762 17 14.9 4.7 13.1
JN Gillespie 71 93 28 1218 20 18.7 4.3 13.0
GAR Lock 49 63 9 742 17 13.7 4.6 13.0
JJ Kelly 36 56 17 664 16 17.0 4.6 12.8
Wasim Bari 81 112 26 1366 21 15.9 3.9 12.5
CM Old 46 66 9 845 17 14.8 4.4 12.5
DR Pringle 30 50 4 695 15 15.1 4.5 12.5
Fazal Mahmood 34 50 6 620 15 14.1 4.5 12.5
Nasim-ul-Ghani 29 50 5 747 15 16.6 4.5 12.5
Abdul Qadir 67 77 11 1029 18 15.6 4.2 12.4
PAJ DeFreitas 44 68 5 934 17 14.8 4.3 12.3
VA Holder 40 59 11 682 16 14.2 4.3 12.3
CJ McDermott 71 90 13 940 19 12.2 4.0 12.2
J Srinath 67 92 21 1009 19 14.2 3.9 12.0
AV Bedser 51 71 15 714 17 12.8 4.1 11.9
JR Thomson 51 73 20 679 17 12.8 4.0 11.7
Z Khan 76 100 22 995 19 12.8 3.6 11.4
RC Motz 32 56 3 612 15 11.5 4.0 11.4
MA Holding 60 76 10 910 17 13.8 3.8 11.4
S Venkataraghavan 57 76 12 748 17 11.7 3.8 11.4
Iqbal Qasim 50 57 15 549 15 13.1 3.9 11.2
DK Lillee 70 90 24 905 18 13.7 3.6 11.2
CV Grimmett 37 50 10 557 14 13.9 3.9 11.0
CEL Ambrose 98 145 29 1439 21 12.4 3.0 10.9
JA Snow 49 71 14 772 16 13.5 3.6 10.7
EAS Prasanna 49 84 20 735 17 11.5 3.4 10.6
D Gough 58 86 18 855 17 12.6 3.4 10.5
JC Laker 46 63 15 676 15 14.1 3.6 10.5
GP Wickramasinghe 40 64 5 555 15 9.4 3.5 10.3
GD McKenzie 60 89 12 945 17 12.3 3.2 10.3
Saqlain Mushtaq 49 78 14 927 16 14.5 3.3 10.1
Mashrafe Mortaza 36 67 5 797 15 12.9 3.4 10.0
J Garner 58 68 14 672 15 12.4 3.3 9.9
GF Lawson 46 68 12 894 15 16.0 3.3 9.9
M Dillon 38 68 3 549 15 8.4 3.3 9.9
AR Caddick 62 95 12 861 17 10.4 3.0 9.9
RO Collinge 35 50 13 533 13 14.4 3.4 9.7
SJ Harmison 62 84 23 742 16 12.2 3.0 9.6
Mushtaq Ahmed 52 72 16 656 15 11.7 3.1 9.6
IR Bishop 43 63 11 632 14 12.2 3.1 9.3
MS Kasprowicz 38 54 12 445 13 10.6 3.1 9.1
Mohammad Sami 35 54 14 475 13 11.9 3.1 9.1
DW Steyn 43 54 13 577 13 14.1 3.1 9.1
Shahadat Hossain 29 55 15 394 13 9.9 3.1 9.0
Shoaib Akhtar 46 67 13 544 14 10.1 2.9 8.9
M Muralitharan 132 162 56 1259 19 11.9 2.2 8.9
DBL Powell 37 57 5 407 13 7.8 3.0 8.8
Waqar Younis 87 120 21 1010 17 10.2 2.4 8.7
GR Dilley 41 58 19 521 13 13.4 2.9 8.7
AA Mallett 38 50 13 430 12 11.6 2.9 8.4
M Ntini 101 116 45 699 16 9.8 2.2 8.1
DL Underwood 86 116 35 937 16 11.6 2.2 8.1
PR Adams 45 55 15 360 12 9.0 2.6 7.9
JB Statham 70 87 28 675 14 11.4 2.3 7.7
S Ramadhin 43 58 14 361 12 8.2 2.5 7.6
RM Hogg 38 58 13 439 12 9.8 2.5 7.6
JM Anderson 54 72 31 513 13 12.5 2.3 7.6
AA Donald 72 94 33 652 14 10.7 2.1 7.4
BS Bedi 67 101 28 656 14 9.0 1.9 7.1
RGD Willis 90 128 55 840 15 11.5 1.8 7.0
DK Morrison 48 71 26 379 12 8.4 2.0 6.8
LR Gibbs 79 109 39 488 13 7.0 1.6 6.1
MJ Hoggard 67 92 27 473 12 7.3 1.6 5.9
DE Malcolm 40 58 19 236 10 6.1 1.7 5.7
GD McGrath 123 136 51 639 13 7.5 1.2 5.5
CA Walsh 132 185 61 936 14 7.5 1.1 5.4
Danish Kaneria 61 84 33 360 11 7.1 1.4 5.4
ARC Fraser 46 67 15 388 10 7.5 1.5 5.3
FH Edwards 43 69 21 248 10 5.2 1.4 5.2
MS Panesar 39 51 17 187 8 5.5 1.3 4.3
CD Collymore 30 52 27 197 8 7.9 1.2 4.3
TM Alderman 41 53 22 203 8 6.5 1.2 4.2
AL Valentine 36 51 21 141 7 4.7 1.0 3.5
EJ Chatfield 43 54 33 180 7 8.6 0.9 3.4
PCR Tufnell 42 59 29 153 7 5.1 0.8 3.3
BS Chandrasekhar 58 80 39 167 6 4.1 0.5 2.3
CS Martin 59 85 44 97 5 2.4 0.3 1.8
![]()
Subscribe to Posts [Atom]