Sunday, February 17, 2008
1800's first-class cricket in England: wicket-keepers
This is Part 9, and also the final instalment, in my series on first-class cricket in the 1800's in England.
1 - data
2 - classification of matches
3 - filling in the gaps
4 - bowlers
5 - batsmen
6 - bowlers across eras
7 - batsmen across eras
8 - all-rounders (across eras)
9 - wicket-keepers
In this post I look at wicket-keepers. I've decided to focus on pure wicket-keeping, and so I've ignored batting. It's a bit boring-listy, but there's a graph below all the tables.
Many of the early scorecards do not indicate who the wicket-keeper was. If there were one or more stumpings, whoever effected the first one was deemed as the keeper. I don't think that this is much of a problem in terms of the tables below, since most of the record-getters played once the scorecards became more complete. Nevertheless, there are probably minor errors, since sometimes teams change wicket-keepers, and I've allocated all the innings byes to the first one (that I know of).
To begin, let's have a look at the leading keepers by dismissal in the 1800's. The last column is the percentage of team runs conceded as byes.
Mordecai Sherwin tops the list. He was, amusingly, a keeper in both cricket and professional soccer. Both Hunter brothers make the top ten.
The leader in terms of dismissals per match (with at least 20 matches) is Charles Smith at 2,69. Behind him are Pilling and Pooley.
If you look down the right-hand column of the above table, one man stands out — Tom Lockyer. He was easily the best in terms of byes in the 1800's. With a qualification of 50 matches:
Fred Huish, early in his career, was showing signs of his greatness as a wicket-keeper. He figures prominently in the next table, which shows the leading keepers by number of dismissals for all first-class matches in England. I've added an extra column — byes per 600 balls. Players from the 19th century are in bold.
Huish never played a Test match, mostly because of Bert Strudwick, two places ahead of him on that table. Bob Taylor is the leader all-time, as we would expect (since he holds the overall first-class record).
My last two tables show a curious phenomenon. The first has the leading keepers by byes percentage. Qualification for both: 60 matches.
Lots and lots of 1980's, with David East the best. Now again, but for byes per 600 balls:
Now Bob Stephenson moves up to first, part of a general movement of 1960's keepers up the rankings. It would appear as though he was unlucky not to play a Test, but with his career coinciding with Taylor's and Alan Knott's, he was kept in county cricket.
I'm guessing that the difference between byes percentage and byes per 600 balls is due to batsmen hitting the ball more often in the 1980's, so that less balls got through to the keeper. Ideally, we'd have a "byes per balls that passed the batsmen". It should be possible to come up with a correction factor based on the run rate (so that you'd use run rate as a proxy for balls hit), but I haven't tried to do so, and in the absence of ball-by-ball data I don't know how accurate it would be.
We know the number of overs in about 95% of the innings that Tom Lockyer kept. In these, he averaged just under 10 byes ber 600 balls, almost exactly the same as Paul Nixon.
I don't want to do era adjustments for wicket-keepers. The balance between bat and ball can change, and so averages should be adjusted accordingly to get comparisons of talent levels. But letting through byes shouldn't change much with eras of low scoring. Still, you might want an idea of how far away from the average keeper of the era someone like Lockyer was, so here's a graph showing the overall byes percentage for each season. There's a lot of early noise because of the low number of matches. There's a huge peak in the era of very low scoring around the 1830's. This isn't just because the byes were constant and the runs were decreasing — there's a peak in the byes per match as well, suggesting that keepers had just as much trouble with the round-arm bowling on those pitches as batsmen did.
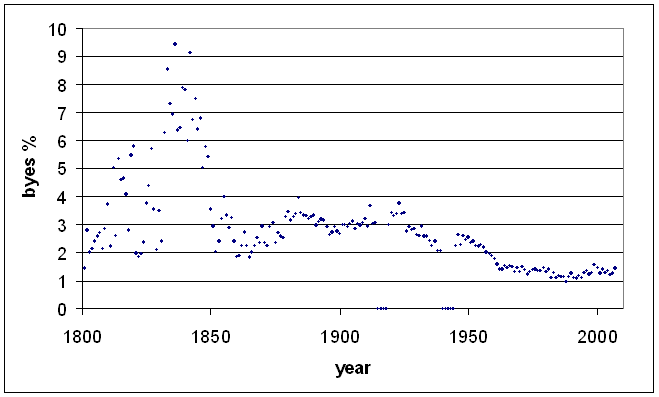
Noteworthy are the jumps that follow the World Wars, telling us that keepers were out of practice and skill levels had dropped. The general trend after World War II was downward until about 1990, when it starts to rise again, presumably when teams started giving more importance to keepers' batting ability.
Looking pre-World-War-I, there are a couple of phases whose causes I don't know. There is a clear rise from the 1860's to the 1880's, before it starts to fall again and then noisily flatten out in around 1900.
And that's the end of this post and this series on 1800's first-class cricket in England. Thanks to anyone who actually read it all.
FIN
1 - data
2 - classification of matches
3 - filling in the gaps
4 - bowlers
5 - batsmen
6 - bowlers across eras
7 - batsmen across eras
8 - all-rounders (across eras)
9 - wicket-keepers
In this post I look at wicket-keepers. I've decided to focus on pure wicket-keeping, and so I've ignored batting. It's a bit boring-listy, but there's a graph below all the tables.
Many of the early scorecards do not indicate who the wicket-keeper was. If there were one or more stumpings, whoever effected the first one was deemed as the keeper. I don't think that this is much of a problem in terms of the tables below, since most of the record-getters played once the scorecards became more complete. Nevertheless, there are probably minor errors, since sometimes teams change wicket-keepers, and I've allocated all the innings byes to the first one (that I know of).
To begin, let's have a look at the leading keepers by dismissal in the 1800's. The last column is the percentage of team runs conceded as byes.
name          start end   mat ct   st  dis   b %
M Sherwin     1876  1896  308 577  205 782   3,05
EW Pooley     1864  1883  289 420  352 772   2,29
H Wood        1881  1899  290 532  114 646   2,87
D Hunter      1888  1899  252 437  180 617   2,98
R Pilling     1877  1889  226 418  187 605   3,04
H Phillips    1869  1891  209 335  184 519   2,97
HR Butt       1890  1899  204 334  130 464   2,46
JH Board      1891  1899  185 329  115 444   2,60
T Lockyer     1849  1866  154 234  112 346   1,78
J Hunter      1878  1888  153 220  118 338   3,91
Mordecai Sherwin tops the list. He was, amusingly, a keeper in both cricket and professional soccer. Both Hunter brothers make the top ten.
The leader in terms of dismissals per match (with at least 20 matches) is Charles Smith at 2,69. Behind him are Pilling and Pooley.
If you look down the right-hand column of the above table, one man stands out — Tom Lockyer. He was easily the best in terms of byes in the 1800's. With a qualification of 50 matches:
name          start end   mat ct   st  dis   b %
T Lockyer     1849  1866  154 234  112 346   1,78
AP Wickham    1878  1899  65  68   42  110   2,03
JA Bush       1870  1890  145 205  93  298   2,13
AE Newton     1885  1899  83  130  50  180   2,21
A Pike        1894  1899  63  99   28  127   2,27
EFS Tylecote  1871  1886  62  90   48  138   2,29
EW Pooley     1864  1883  289 420  352 772   2,29
FH Huish      1895  1899  88  208  23  231   2,36
JP Whiteside  1888  1899  108 159  44  203   2,45
HR Butt       1890  1899  204 334  130 464   2,46
Fred Huish, early in his career, was showing signs of his greatness as a wicket-keeper. He figures prominently in the next table, which shows the leading keepers by number of dismissals for all first-class matches in England. I've added an extra column — byes per 600 balls. Players from the 19th century are in bold.
name          start end   mat ct   st  dis   b %   b/600
RW Taylor     1960  1988  547 1257 155 1412  1,03  2,76
H Strudwick   1902  1927  610 1133 220 1353  2,97  8,63
JT Murray     1952  1975  546 1116 219 1335  2,05  5,50
FH Huish      1895  1914  493 922  377 1299  2,91  8,35
D Hunter      1888  1909  543 910  347 1257  2,59  6,69
B Taylor      1949  1973  520 1036 200 1236  1,54  4,28
HR Butt       1890  1912  543 949  275 1224  3,05  8,89
H Elliott     1920  1947  517 886  292 1178  1,84  4,67
JH Board      1891  1913  482 810  348 1158  2,63  7,82
RC Russell    1981  2004  405 1033 111 1144  0,93  2,92
Huish never played a Test match, mostly because of Bert Strudwick, two places ahead of him on that table. Bob Taylor is the leader all-time, as we would expect (since he holds the overall first-class record).
My last two tables show a curious phenomenon. The first has the leading keepers by byes percentage. Qualification for both: 60 matches.
name          start end   mat ct   st  dis   b %   b/600
DE East       1981  1989  189 479  53  532   0,81  2,40
RJ Turner     1988  2005  233 666  49  715   0,83  2,88
P Whitticase  1984  1995  129 309  14  323   0,84  2,63
GR Stephenson 1967  1980  270 584  77  661   0,85  2,23
BJM Maher     1981  1993  125 279  14  293   0,87  2,85
RC Russell    1981  2004  405 1033 111 1144  0,93  2,92
SJ Rhodes     1984  2004  390 1009 101 1110  0,95  3,02
CP Metson     1981  2001  230 556  51  607   0,95  3,03
CMW Read      1998  2007  151 462  23  485   0,99  3,45
APE Knott     1964  1985  411 1012 101 1113  1,02  2,76
Lots and lots of 1980's, with David East the best. Now again, but for byes per 600 balls:
name          start end   mat ct   st  dis   b %   b/600
GR Stephenson 1967  1980  270 584  77  661   0,85  2,23
DE East       1981  1989  189 479  53  532   0,81  2,40
P Whitticase  1984  1995  129 309  14  323   0,84  2,63
RW Taylor     1960  1988  547 1257 155 1412  1,03  2,76
APE Knott     1964  1985  411 1012 101 1113  1,02  2,76
BJM Maher     1981  1993  125 279  14  293   0,87  2,85
RJ Turner     1988  2005  233 666  49  715   0,83  2,88
RC Russell    1981  2004  405 1033 111 1144  0,93  2,92
BSV Timms     1959  1971  231 456  70  526   1,24  3,00
SJ Rhodes     1984  2004  390 1009 101 1110  0,95  3,02
Now Bob Stephenson moves up to first, part of a general movement of 1960's keepers up the rankings. It would appear as though he was unlucky not to play a Test, but with his career coinciding with Taylor's and Alan Knott's, he was kept in county cricket.
I'm guessing that the difference between byes percentage and byes per 600 balls is due to batsmen hitting the ball more often in the 1980's, so that less balls got through to the keeper. Ideally, we'd have a "byes per balls that passed the batsmen". It should be possible to come up with a correction factor based on the run rate (so that you'd use run rate as a proxy for balls hit), but I haven't tried to do so, and in the absence of ball-by-ball data I don't know how accurate it would be.
We know the number of overs in about 95% of the innings that Tom Lockyer kept. In these, he averaged just under 10 byes ber 600 balls, almost exactly the same as Paul Nixon.
I don't want to do era adjustments for wicket-keepers. The balance between bat and ball can change, and so averages should be adjusted accordingly to get comparisons of talent levels. But letting through byes shouldn't change much with eras of low scoring. Still, you might want an idea of how far away from the average keeper of the era someone like Lockyer was, so here's a graph showing the overall byes percentage for each season. There's a lot of early noise because of the low number of matches. There's a huge peak in the era of very low scoring around the 1830's. This isn't just because the byes were constant and the runs were decreasing — there's a peak in the byes per match as well, suggesting that keepers had just as much trouble with the round-arm bowling on those pitches as batsmen did.
Noteworthy are the jumps that follow the World Wars, telling us that keepers were out of practice and skill levels had dropped. The general trend after World War II was downward until about 1990, when it starts to rise again, presumably when teams started giving more importance to keepers' batting ability.
Looking pre-World-War-I, there are a couple of phases whose causes I don't know. There is a clear rise from the 1860's to the 1880's, before it starts to fall again and then noisily flatten out in around 1900.
And that's the end of this post and this series on 1800's first-class cricket in England. Thanks to anyone who actually read it all.
FIN
# posted by David Barry : 19:36

Comments:
<< Home
Hello Good Friend
I’m sure you are concerned about all the worlds ills, and you probably wish there was at least one thing you could do.
Well now there is visit cricketwithballs.com and Sign my David Hussey for Australia Petition and you’ll be contributing to world peace.
Vote David Hussey, he will represent you the people.

Looking at the prices paid for IPL players at the Mumbai auction, I get the impression that Indian players are valued far more than their performances would justify, perhaps on account of how they will draw in crowds. Would it be possible to calculate premiums for Indian players as a percentage of value? Aside from their bowling and batting averages, is there anything else that would enter your sums?
Post a Comment
# posted by  : 20 Feb 2008, 4:03:00 pm
: 20 Feb 2008, 4:03:00 pmSubscribe to Post Comments [Atom]
<< Home
![]()
Subscribe to Posts [Atom]