Monday, August 25, 2008
Averages and strike rates in ODI's
Rating batsmen in one-day cricket is difficult because both average and strike rate are important, and it's not clear how they should be weighted.
I can't see a theoretical solution (multiplying the two measures might be good enough, but it seems arbitrary), and I think that the actual answer will come from simulations. In this post, I show some results from some woefully inaccurate simulations. But hopefully even though the total scores were below what they should be, the equivalences of various averages and strike rates should be reasonably accurate.
Here's what I did. I took the overall average and strike rate since 2000 for each batting position (I think using the top eight teams). I ran a largish number (20000) simulations to get what the "average" total score is, and it turned out to be 208 (I told you it was inaccurate...).
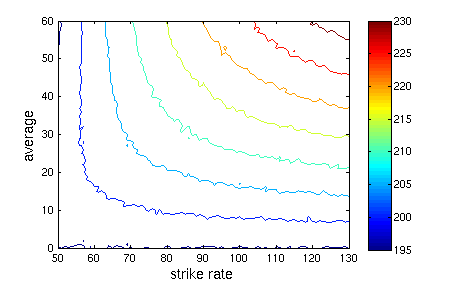
Then, I replaced one of the openers with a batsman with an average of 1, strike rate 50, then average 2, strike rate 50, average 3, strike rate 50, and so on, doing 20000 simulations each time to get the average total score. I did this until I had a grid of average total scores for strike rates from 50 to 130, and averages from 1 to 60. Then I made contour plots with curves of equal value.
The simulations assumed a constant run rate and exponentially distributed scores. Not realistic, but it was straightforward to do and avoided doing ball-by-ball simulations.
There's a bit of noise in the results. Here's the contour plot for openers:

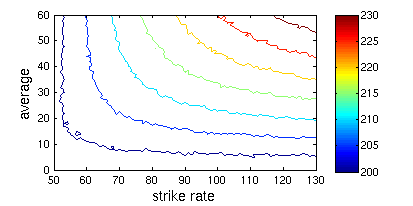
The number 3:

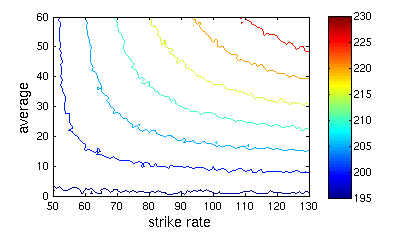
The number 4:

Because I was exceedingly lazy, the contours in the separate plots may not correspond to the same total team scores. But you will agree that the pictures are colourful.
Now for some numbers. In each of the following little tables, the rows are equivalent. So, an opener with an average of 50 and a strike rate of 73 is worth the same as an opener with an average of 25 and a strike rate of 101. According to the simulations, at least.
Making an average score of 210, as an opener:
210, number 3:
210, number 4:
I didn't get past number 4. I'll do the rest tomorrow.
I imagine that the curves would change with more accurate simulations, but this is at least a start.
I can't see a theoretical solution (multiplying the two measures might be good enough, but it seems arbitrary), and I think that the actual answer will come from simulations. In this post, I show some results from some woefully inaccurate simulations. But hopefully even though the total scores were below what they should be, the equivalences of various averages and strike rates should be reasonably accurate.
Here's what I did. I took the overall average and strike rate since 2000 for each batting position (I think using the top eight teams). I ran a largish number (20000) simulations to get what the "average" total score is, and it turned out to be 208 (I told you it was inaccurate...).
Then, I replaced one of the openers with a batsman with an average of 1, strike rate 50, then average 2, strike rate 50, average 3, strike rate 50, and so on, doing 20000 simulations each time to get the average total score. I did this until I had a grid of average total scores for strike rates from 50 to 130, and averages from 1 to 60. Then I made contour plots with curves of equal value.
The simulations assumed a constant run rate and exponentially distributed scores. Not realistic, but it was straightforward to do and avoided doing ball-by-ball simulations.
There's a bit of noise in the results. Here's the contour plot for openers:

The number 3:

The number 4:

Because I was exceedingly lazy, the contours in the separate plots may not correspond to the same total team scores. But you will agree that the pictures are colourful.
Now for some numbers. In each of the following little tables, the rows are equivalent. So, an opener with an average of 50 and a strike rate of 73 is worth the same as an opener with an average of 25 and a strike rate of 101. According to the simulations, at least.
Making an average score of 210, as an opener:
avg  sr
50   73
45   74
40   76
35   80
30   87
25   101
210, number 3:
avg  sr
50   69
45   71
40   73
35   76
30   82
25   96
210, number 4:
avg  sr
50   72
45   75
40   77
35   82
30   90
25   110
I didn't get past number 4. I'll do the rest tomorrow.
I imagine that the curves would change with more accurate simulations, but this is at least a start.
Comments:
<< Home
hi, this is good stuff. i was wondering how you arrived at the average total score, because as you say it's low. the thing is the side batting second in a low-scoring game can reach the target in much less than 50 overs, and if you don't take that into account, your average total will be skewed. my own feeling is that the strike rate is more important, with a minimum cutoff average of 30 to 35 depending on batting position... do check out my blog - cricketkeeper.blogspot.com
Hi Sumit. I didn't simulate any second innings stuff - just isolated innings.
The idea of exponentially distributed scores is that batsmen never get their eye in (or always have their eye in, whichever way you look at it). I use this approximation because it makes the simulations MUCH easier.
One problem is that I assumed constant strike rates (again because it was easy) - this means that if no batsman has a strike rate of more than 80, that no simulated innings will ever pass 240. So the average is guaranteed to be low.
As always David, creative, interesting, illuminating and somewhat confusing for a mere mortal like myself. Can't thank you enough for including graphical representations.
Love your work mate!
I read The bling Kolkatta Knight Riders are coming to Bris Vegas.
Will you be going down to the Gabba to check them out?
If you are I'd appreciate a little report on your observations.
Love your work mate!
I read The bling Kolkatta Knight Riders are coming to Bris Vegas.
Will you be going down to the Gabba to check them out?
If you are I'd appreciate a little report on your observations.
Thanks for that Nesta, I had no idea that the Kolkata team was coming here. Apparently they'll be having a game against Queensland and some other sides, so I'll be sure to get to the Queensland game at least.
I'm not too sure how much I'll learn from watching forty overs of cricket, but hopefully there'll be a crowd and a fun T20 atmosphere.
Post a Comment
I'm not too sure how much I'll learn from watching forty overs of cricket, but hopefully there'll be a crowd and a fun T20 atmosphere.
Subscribe to Post Comments [Atom]
<< Home
Subscribe to Comments [Atom]

