Sunday, April 27, 2008
WG Grace
WG Grace had a very long career — he played a long time after his peak. That's why, when looking at his career averages (unadjusted first-class averages from CricketArchive: bat 39,45; bowl 18,14), you don't see why he's such a huge figure in the history of the game. His aggregates are huge, sure, but it looks like he was a great who played for a long time, rather than a rival to Bradman as the greatest ever.
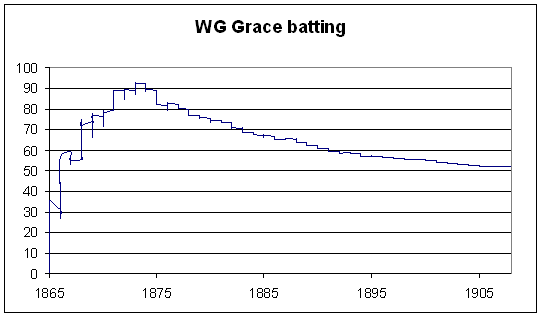
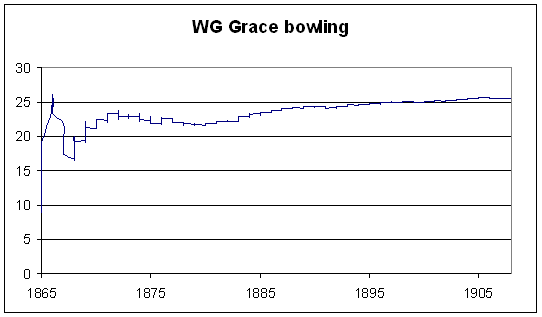
To see where this latter perception comes from, I plotted his cumulative adjusted averages (weighting innings according to the quality of the attack, relative to an overall average of 24,5) against time. I considered only first-class matches in England (since I know that that part of my database works — I didn't want to spend half a week debugging Australian matches that I haven't tested yet).


To give a feel for the batting scale: Bradman is at 98,9; Headley 65,8; Ranji 60,5; Merchant 56,3 (those are the top four); Mike Hussey 52,2; Barry Richards 45,3.
Bowling scale: Murali 13,7; Lindwall 14,1 (top two); Darren Gough 20,9; Eddie Hemmings 25,6.
All references to averages below are adjusted ones.
Grace's (adjusted) batting average peaked at the end of the 1873 season at 92,8; at this time he had scored over 10000 first-class runs. Batting doesn't get much more Bradmanesque. By 1880, he had 19560 runs at 74,5. This also marks the start of his decline as a bowler. By the end of 1880, he had 1335 wickets at 21,9. If Grace had stopped playing then, his ratio of batting average to bowling average (3,4) would have been well clear of second place (Keith Miller at 2,8).
Even in 1886, though (more than 20 years after the start of his first-class career), his batting average was higher than Headley's.
The decline in batting average is very marked — it almost falls to 50 by the end of his career. The rise in his bowling average is much more gentle, because as he got older he bowled less, not bowling more than 4000 balls in a season after 1888.
To see where this latter perception comes from, I plotted his cumulative adjusted averages (weighting innings according to the quality of the attack, relative to an overall average of 24,5) against time. I considered only first-class matches in England (since I know that that part of my database works — I didn't want to spend half a week debugging Australian matches that I haven't tested yet).


To give a feel for the batting scale: Bradman is at 98,9; Headley 65,8; Ranji 60,5; Merchant 56,3 (those are the top four); Mike Hussey 52,2; Barry Richards 45,3.
Bowling scale: Murali 13,7; Lindwall 14,1 (top two); Darren Gough 20,9; Eddie Hemmings 25,6.
All references to averages below are adjusted ones.
Grace's (adjusted) batting average peaked at the end of the 1873 season at 92,8; at this time he had scored over 10000 first-class runs. Batting doesn't get much more Bradmanesque. By 1880, he had 19560 runs at 74,5. This also marks the start of his decline as a bowler. By the end of 1880, he had 1335 wickets at 21,9. If Grace had stopped playing then, his ratio of batting average to bowling average (3,4) would have been well clear of second place (Keith Miller at 2,8).
Even in 1886, though (more than 20 years after the start of his first-class career), his batting average was higher than Headley's.
The decline in batting average is very marked — it almost falls to 50 by the end of his career. The rise in his bowling average is much more gentle, because as he got older he bowled less, not bowling more than 4000 balls in a season after 1888.
Comments:
<< Home
Very interesting indeed - but where does the 24.5 come from? Is it over all matches until now/recently, or only covering the period in which Grace played? I'd think the averages for the period during which he played, or say that plus 10 years on either side, would make more sense.
24.5 is the overall first-class average in England (up to the end of 2007). I chose it because it makes the values fairly naturally intepretable to the modern eye (though they're a little bit lower in general than today's averages) - Bradman averaged just under 100, Waugh averages a bit over 50, etc.
Kuttappan, remember that it's a graph of cumulative career average. In 1895, he averaged 51 (that's a raw average, not ajdusted), which is higher than the seasons immediately before and after, but, once adjusted, about the same as his career average up until that point.
His adjusted average actually doesn't decrease much from 1894 to 1895: 57.0 to 56.9.
Post a Comment
His adjusted average actually doesn't decrease much from 1894 to 1895: 57.0 to 56.9.
Subscribe to Post Comments [Atom]
<< Home
Subscribe to Comments [Atom]
