Sunday, March 09, 2008
Wicket-keepers and byes
In my post on first-class wicket-keepers in England, I pointed out a curious trend — there were quite a lot of keepers from the 1980's near the top of the table of byes as a percentage of team runs. I guessed that it was because of the higher run rates during this time, compared with previous decades (and because of the trend afterwards to choose keepers based on their batting). Using byes per 600 balls gives more reasonable results, but it should still be biased by the prevailing run rate — if the run rate is higher, the batsmen are probably hitting more balls, so the keeper's bye rate should be lower.
Ideally, we'd have a stat for byes per balls that pass the batsman. But since we'd need ball-by-ball data to find this, we have to make do without. Yesterday I had an idea of how to adjust for run rates. I thought it was a good idea, but it didn't work. First, I'll explain what I wanted to do and how it should have worked.
You can't use bye rates and run rates and look for a correlation over all matches — the average standard of wicket-keeping can (and does) change with era. But the standard of an individual keeper should be fairly consistent over his career, and every keeper will keep in innings where the opposition scores heavily, and in innings where the scoring is slow. Since some keepers in England play many hundreds of matches, there should be enough data at an individual level to work out what the trend is.
So for each keeper, I took all innings kept and ordered them by the run rate (when calculating the run rate, I ignored byes). To avoid the problem of what to do with very short innings (and to make the graphs nicer), I aggregated the data into ten bins, and found the overall average number of byes per 600 balls for each bin. The result for Alan Knott is below.
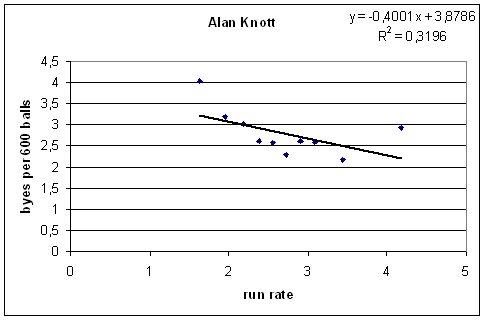
It's not perfect, but the overall trend is pretty clear — at higher run rates, Knotty gave away less byes.
That was the idea. It turns out that not all keepers have this trend. Here's Jack Russell:
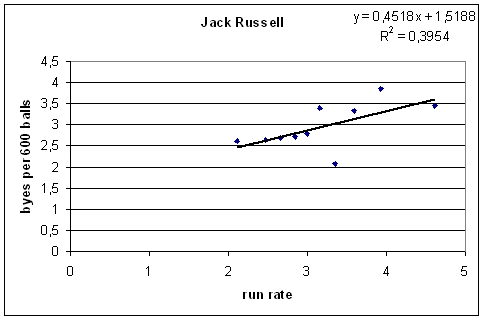
It's a nice trend, in the wrong direction.
Taking keepers who kept in at least 100 innings, there are actually more with positive slopes than negative. Some of this effect might be noise, so I did the same calculation but calculated the regression lines using only the middle eight bins (perhaps short innings come up disproportionately often in the first and last bins, and so the data's less reliable).
Then, I considered only keepers whose career began after World War II, and who kept in at least 300 innings. The result? Twenty-nine keepers with positive slope, twenty-eight with negative, one flat. The average slope for this set of keepers was 0,01.
There does appear to be a slight tendency towards negative slopes for those with very long careers (i.e., more than 725 innings), but that might just be noise, and it's still not a hard-and-fast rule — Bob Taylor kept in 976 innings, and has a slope of 0,235.
So that's a bit of a surprising dead end of a conclusion. Wicket-keepers don't generally give away less byes when the batsmen score runs faster.
Ideally, we'd have a stat for byes per balls that pass the batsman. But since we'd need ball-by-ball data to find this, we have to make do without. Yesterday I had an idea of how to adjust for run rates. I thought it was a good idea, but it didn't work. First, I'll explain what I wanted to do and how it should have worked.
You can't use bye rates and run rates and look for a correlation over all matches — the average standard of wicket-keeping can (and does) change with era. But the standard of an individual keeper should be fairly consistent over his career, and every keeper will keep in innings where the opposition scores heavily, and in innings where the scoring is slow. Since some keepers in England play many hundreds of matches, there should be enough data at an individual level to work out what the trend is.
So for each keeper, I took all innings kept and ordered them by the run rate (when calculating the run rate, I ignored byes). To avoid the problem of what to do with very short innings (and to make the graphs nicer), I aggregated the data into ten bins, and found the overall average number of byes per 600 balls for each bin. The result for Alan Knott is below.
It's not perfect, but the overall trend is pretty clear — at higher run rates, Knotty gave away less byes.
That was the idea. It turns out that not all keepers have this trend. Here's Jack Russell:
It's a nice trend, in the wrong direction.
Taking keepers who kept in at least 100 innings, there are actually more with positive slopes than negative. Some of this effect might be noise, so I did the same calculation but calculated the regression lines using only the middle eight bins (perhaps short innings come up disproportionately often in the first and last bins, and so the data's less reliable).
Then, I considered only keepers whose career began after World War II, and who kept in at least 300 innings. The result? Twenty-nine keepers with positive slope, twenty-eight with negative, one flat. The average slope for this set of keepers was 0,01.
There does appear to be a slight tendency towards negative slopes for those with very long careers (i.e., more than 725 innings), but that might just be noise, and it's still not a hard-and-fast rule — Bob Taylor kept in 976 innings, and has a slope of 0,235.
So that's a bit of a surprising dead end of a conclusion. Wicket-keepers don't generally give away less byes when the batsmen score runs faster.
# posted by David Barry : 12:39

![]()
Subscribe to Posts [Atom]