Tuesday, March 11, 2008
Evaluating captaincy
Captaincy is one area of cricket that does not receive much statistical scrutiny. It is not hard to figure out why — about the only thing you could easily compute would be how many wins the team had, and this figure is strongly dependent on the quality of the team. To remedy this, I've come up with a way of estimating how many wins, draws, and losses that a captain would be expected to have, given the strength of his side, the strength of the opponents, and whether they're at home or away. Once we have these, we can compare to the captain's actual record, and see who does better or worse.
First, I'll explain how to get the expected results. This method is a bit rough and can certainly be improved in places, but overall I think it does a good job. For each team, I calculate the average batting average (averages weighted by the averages of the bowlers faced), and average bowling average (with wickets wickets weighted by the batting average of the batsman dismissed). The latter is a little bit tricky — some teams use more bowlers than others. So, for each innings, I weighted the bowling averages by the number of balls bowled by each bowler. Then, if two innings were bowled, I took the average of the two.
Then you subtract the average bowling average from the average batting average, and you get a rating for the team. Do the same for the other side, and you get a measure of the difference in strength between the two sides.
Next you go through all Tests, calculate the difference in strength (to make things consistent, I did home team rating minus away team rating), and find how many wins, draws, and losses there are at various differences in strengths. I did this by binning all Tests into 20 bins. Plotted on the graph below are the expected fraction of wins and draws.
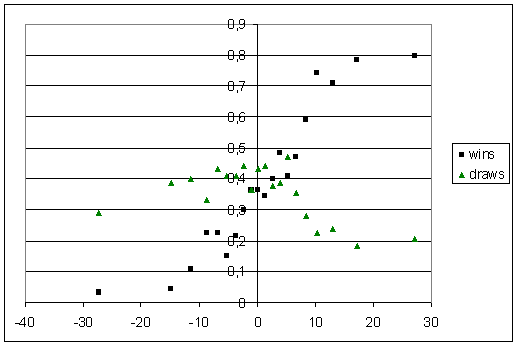
The fractions of wins does basically what we'd expect — it starts out flat and very low for teams that are outclassed, before rising steadily before plateauing. There are always going to be some draws (because of rain), so the fraction of wins won't hit zero or one. Even the weakest of home teams can achieve a draw rate of about 30% (well, maybe not Bangladesh), whereas very weak teams away can only draw about 20% of Tests.
The trend in draws is a bit different. It seems to go gently upwards until the teams are evenly matched, and then more sharply downwards as the home team becomes stronger.
I approximated these curves with piecewise linear functions. For the draws, it's flat for x less than -27, then upwards so that it hits the y-axis at y = 0,424, then downwards until x = 17, and then flat, at a value of 0,185.
For the wins, it's flat at 0,031 below x = -13,7, then upwards until x = 17,2, and then flat at a value of 0,785.
So now, for each Test, I calculate the difference in strength. Then I plug that number into the fitted graphs to get a fraction of a win, draw, and loss. For example, suppose that the teams are evenly matched. Then the home side gets 0,366 wins; 0,424 draws; 0,21 losses. The wins and losses for the away side are flipped: 0,21 wins and 0,366 losses.
You do this for each Test that a captain plays, and add up the expected wins, draws, and losses. Now we can compare to the actual record.
There's a question here about how to deal with draws. I decided to ignore them, for a couple of reasons. The first is that teams which score runs faster should have less draws, but I didn't take strike rate into account when doing the regressions above (I don't have strike rate data for all Test batsmen). Also, all Tests in Australia (as well as some elsewhere) were played to a finish between 1882/3 and World War II — no draws in a major cricketing country for over sixty years!
So instead I calculated the fraction of wins out of matches that ended in a result, that is: wins / (wins + losses). Do this for the actual value, divide by the expected value, and you get a ratio saying how much better or worse the captain's record is compared to what would be expected.
Whether or not it is reasonable to ascribe all the difference to the captain is certainly debatable, but it seems the best thing to do for now. Here are the best captains, as measured by this statistic. Qualification 20 Tests as captain.
Abdul Kardar, Pakistan's first Test captain, comes out on top. You can see that he didn't actually win many Tests, but his team managed to draw a lot that they "should" have lost. It is reassuring to see Mike Brearley so high up. Inzamam and Michael Vaughan are fifth and sixth.
Most of those high in the table did not have extended careers as captain, so perhaps some of them were just lucky and are higher than they should be. Of those with at least 50 Tests, Stephen Fleming is the best, just shading Viv Richards and Clive Lloyd.
At the other end, we have those who took their teams and un-inspired them to ineptitude:
Kim Hughes was pretty lucky to get to captain Australia in 28 Test matches.
A couple of others to finish (feel free to request others).
Mark Taylor 0,93, but probably disproportionately many of his losses were in dead rubbers. He also only had 11 draws (expected 17,5), in the era before Waugh made draws almost extinct for Australia.
Sunil Gavaskar 1,10 is the best Indian captain. He achieved this record by turning five expected wins into draws, and seven expected losses into draws. Not exciting stuff, but it gave him an overall positive record (9 wins, 30 draws, 8 losses).
Imran Khan at 1,08 didn't do that much better than he should have, and was also pretty drawish (14-26-8, expected 17,6-18,0-12,3). He did a bit better than Javed, who scores 0,99.
First, I'll explain how to get the expected results. This method is a bit rough and can certainly be improved in places, but overall I think it does a good job. For each team, I calculate the average batting average (averages weighted by the averages of the bowlers faced), and average bowling average (with wickets wickets weighted by the batting average of the batsman dismissed). The latter is a little bit tricky — some teams use more bowlers than others. So, for each innings, I weighted the bowling averages by the number of balls bowled by each bowler. Then, if two innings were bowled, I took the average of the two.
Then you subtract the average bowling average from the average batting average, and you get a rating for the team. Do the same for the other side, and you get a measure of the difference in strength between the two sides.
Next you go through all Tests, calculate the difference in strength (to make things consistent, I did home team rating minus away team rating), and find how many wins, draws, and losses there are at various differences in strengths. I did this by binning all Tests into 20 bins. Plotted on the graph below are the expected fraction of wins and draws.
The fractions of wins does basically what we'd expect — it starts out flat and very low for teams that are outclassed, before rising steadily before plateauing. There are always going to be some draws (because of rain), so the fraction of wins won't hit zero or one. Even the weakest of home teams can achieve a draw rate of about 30% (well, maybe not Bangladesh), whereas very weak teams away can only draw about 20% of Tests.
The trend in draws is a bit different. It seems to go gently upwards until the teams are evenly matched, and then more sharply downwards as the home team becomes stronger.
I approximated these curves with piecewise linear functions. For the draws, it's flat for x less than -27, then upwards so that it hits the y-axis at y = 0,424, then downwards until x = 17, and then flat, at a value of 0,185.
For the wins, it's flat at 0,031 below x = -13,7, then upwards until x = 17,2, and then flat at a value of 0,785.
So now, for each Test, I calculate the difference in strength. Then I plug that number into the fitted graphs to get a fraction of a win, draw, and loss. For example, suppose that the teams are evenly matched. Then the home side gets 0,366 wins; 0,424 draws; 0,21 losses. The wins and losses for the away side are flipped: 0,21 wins and 0,366 losses.
You do this for each Test that a captain plays, and add up the expected wins, draws, and losses. Now we can compare to the actual record.
There's a question here about how to deal with draws. I decided to ignore them, for a couple of reasons. The first is that teams which score runs faster should have less draws, but I didn't take strike rate into account when doing the regressions above (I don't have strike rate data for all Test batsmen). Also, all Tests in Australia (as well as some elsewhere) were played to a finish between 1882/3 and World War II — no draws in a major cricketing country for over sixty years!
So instead I calculated the fraction of wins out of matches that ended in a result, that is: wins / (wins + losses). Do this for the actual value, divide by the expected value, and you get a ratio saying how much better or worse the captain's record is compared to what would be expected.
Whether or not it is reasonable to ascribe all the difference to the captain is certainly debatable, but it seems the best thing to do for now. Here are the best captains, as measured by this statistic. Qualification 20 Tests as captain.
                    ----expected----  --actual--  exp   act
name            mat w     d     l     w   d   l   w%    w%    ratio
Abdul Kardar    23  5,1   7,1   10,8  6   11  6   0,32  0,50  1,56
GP Howarth      30  7,9   11,1  11,1  11  12  7   0,42  0,61  1,47
J Darling       21  5,8   7,8   7,4   7   10  4   0,44  0,64  1,44
JM Brearley     31  11,3  12,0  7,7   18  9   4   0,60  0,82  1,37
Inzamam-ul-Haq  33  6,8   11,9  14,3  10  10  13  0,32  0,43  1,35
MP Vaughan      41  15,0  14,5  11,5  21  11  9   0,57  0,70  1,24
RB Richardson   24  8,4   8,2   7,4   11  7   6   0,53  0,65  1,21
GA Gooch        34  8,1   12,6  13,3  10  12  12  0,38  0,45  1,20
CA Walsh        22  5,7   7,6   8,7   6   9   7   0,40  0,46  1,16
DG Bradman      24  11,7  7,7   4,6   15  6   3   0,72  0,83  1,16
SP Fleming      80  23,6  27,1  29,3  28  25  27  0,45  0,51  1,14
RB Simpson      39  10,9  14,2  13,9  12  15  12  0,44  0,50  1,14
IVA Richards    50  21,7  18,2  10,1  27  15  8   0,68  0,77  1,13
CH Lloyd        74  31,3  27,0  15,7  36  26  12  0,67  0,75  1,13
N Hussain       45  14,0  15,5  15,5  17  13  15  0,48  0,53  1,12
Abdul Kardar, Pakistan's first Test captain, comes out on top. You can see that he didn't actually win many Tests, but his team managed to draw a lot that they "should" have lost. It is reassuring to see Mike Brearley so high up. Inzamam and Michael Vaughan are fifth and sixth.
Most of those high in the table did not have extended careers as captain, so perhaps some of them were just lucky and are higher than they should be. Of those with at least 50 Tests, Stephen Fleming is the best, just shading Viv Richards and Clive Lloyd.
At the other end, we have those who took their teams and un-inspired them to ineptitude:
                    ----expected----  --actual--  exp   act
name            mat w     d     l     w   d   l   w%    w%    ratio
M Azharuddin    47  18,5  17,2  11,3  14  19  14  0,62  0,50  0,80
HH Streak       21  5,0   6,1   9,9   4   6   11  0,33  0,27  0,80
MW Gatting      23  5,1   8,9   9,1   2   16  5   0,36  0,29  0,79
CL Hooper       22  5,2   7,8   8,9   4   7   11  0,37  0,27  0,72
BS Bedi         22  7,0   7,8   7,2   6   5   11  0,49  0,35  0,72
DI Gower        32  7,0   12,0  13,0  5   9   18  0,35  0,22  0,62
JR Reid         34  5,3   11,1  17,6  3   13  18  0,23  0,14  0,62
AC MacLaren     22  6,6   7,9   7,5   4   7   11  0,47  0,27  0,57
KJ Hughes       28  7,3   10,3  10,4  4   11  13  0,41  0,24  0,57
A Flower        20  3,5   6,4   10,1  1   9   10  0,26  0,09  0,36
Kim Hughes was pretty lucky to get to captain Australia in 28 Test matches.
A couple of others to finish (feel free to request others).
Mark Taylor 0,93, but probably disproportionately many of his losses were in dead rubbers. He also only had 11 draws (expected 17,5), in the era before Waugh made draws almost extinct for Australia.
Sunil Gavaskar 1,10 is the best Indian captain. He achieved this record by turning five expected wins into draws, and seven expected losses into draws. Not exciting stuff, but it gave him an overall positive record (9 wins, 30 draws, 8 losses).
Imran Khan at 1,08 didn't do that much better than he should have, and was also pretty drawish (14-26-8, expected 17,6-18,0-12,3). He did a bit better than Javed, who scores 0,99.
# posted by David Barry : 21:35

Comments:
<< Home
What about: Sobers vs Richards vs Lara, Border vs Waugh vs Ponting, Cronje vs Pollock vs G Smith, Ganguly vs Tendulkar vs Dravid, Ranatunga vs Jayasuriya vs Jayawardene.

Expected wins-draws-losses; actual wins-draws-losses; ratio
Richards: 21,7 - 18,2 - 10,1; 27 - 15 - 8; 1,13
Lara: 10,5 - 15,6 - 20,0; 10 - 11 - 25; 0,83
Sobers: 14,2 - 14,9 - 9,9; 9 - 20 - 10; 0,81
Ponting: 24,4 - 11,5 - 4,1; 30 - 6 - 4; 1,03
Border: 35,9 - 34,7 - 22,5; 32 - 39 - 22; 0,96
Waugh: 33,3 - 18,2 - 5,5; 41 - 7 - 9; 0,96
Pollock: 11,9 - 8,6 - 5,5; 14 - 7 - 5; 1,08
Cronje: 25,1 - 18,1 - 9,8; 27 - 15 - 11; 0,99
Smith: 24,3 - 27,7 - 12,0; 26 - 13 - 15; 0,95
Ganguly: 19,5 - 16,2 - 13,3; 21 - 15 - 13; 1,04
Dravid: 9,6 - 9,4 - 6,0; 9 - 10 - 6; 0,98
Tendulkar: 6,1 - 8,7 - 10,2; 4 - 12 - 9; 0,82
Jayawardene: 7,3 - 5,3 - 5,4; 9 - 4 - 5; 1,11
Jayasuriya: 15,1 - 12,9 - 10,0; 18 - 8 - 12; 1,00
Ranatunga: 16,5 - 18,7 - 20,8; 12 - 25 - 19; 0,88
Very interesting stuff, as always.
Would it be a fair conclusion to draw that Australian captains, on the whole, have little effect on the game either way, as few are in either your groups.
Perhaps they're just good and get on with it.
Ponting has a great team, for instance, but his captaincy stinks. But the team is so good, they just do it.
I think that's a good conclusion, Atheist. Overall, captaincy doesn't seem to have much of an effect - two thirds of the captains with at least 15 Tests are within 20% of where they should be. A very good captain, then, might be one who wins six Tests instead of five.
Certainly Ponting and Waugh are near the middle of the pack because they've had excellent teams, suggesting that indeed, any idiot could have led Australia to loads of victories in the past decade.
Even if Ponting won every single game as captain, he'd still only have a ratio of 1,16 - less than Michael Vaughan. That's how strong his team has been (and how weak everyone else has been).
That probably illustrates a shortcoming of this method of ranking captains, but I can't see how to fix it.
I suppose captaincy isn't always about winning a match, but, like any discipline, winning those little moments.
Perhaps you could do something similar for wickets. If you get a batsman of quality X and a bowler of quality Y you should expect outcome Z, but if you have a certain field formation, then...
Actually, there are about a million variables for that route. How good are you at regression?
Perhaps you could do something similar for wickets. If you get a batsman of quality X and a bowler of quality Y you should expect outcome Z, but if you have a certain field formation, then...
Actually, there are about a million variables for that route. How good are you at regression?
I'm certainly not an expert at regression, but I downloaded gretl near the start of this blog and I have done one "big" regression with sixteen independent variables. "Big" here means more than two.
I'd have to work at the level of innings or matches, though, as I don't have a ball-by-ball database.
Still, it's an interesting question. To me the most important thing is the match result - there's no point winning "the moments" if they don't add up over a career to some extra victories. But it'd be interesting to see how much a bowler's average improves under a good captain.
Which brings me to another point, which affects both what I've done already and my new regression project for tomorrow. Captains like Border, Fleming, and Lloyd would have had bowlers who played most or all of their careers under one captain. Their bowling averages would already have the effect of captaincy built into them. Ideally, we'd be able to work out a 'captain-independent' bowling average.
I think it should be possible, but I'd have to think about it for a while. We do see Fleming having more wins than he should, despite having 80 Tests as captain. But probably his rating's a bit low.
But ignoring that, I should have an estimate on the effect of captains on bowling averages in a couple of days. The only bit that'll take me a bit of time is adjusting for ground. All the other variables would be almost ready to throw into gretl now.
It's me again! (Anon from the FC post) Still loving the blog no matter how old. If you're still able to take requests, I'd be very interested to see Frank Worrell's figures, especially as compared to Lloyd and Richards (whose figures are, obviously, already on the tables listed). Worrell captained in fewer than 20 Tests so I'm not sure where he would figure, but I know his success rate was very high (but then he also had a good team). Established orthodoxy now seems to have Lloyd and Richards enshrined as the best Windies captains - for good reasons - but I wonder if Worrell has been overlooked.
# posted by  : 1 Oct 2015, 3:27:00 am
: 1 Oct 2015, 3:27:00 am
Hi Tom! I dug up my backup drive and found the full spreadsheet, last edited December 2010 but I don't know how up-to-date my database was.
Worrell's actual-to-expected ratio was 1.34*, so he'd slot in pretty high in the table, though there are others higher with a relaxed qualification on number of matches. Looking back on it, the metric is not particularly robust -- Chris Gayle had 3 wins as captain out of 20, far better in relative terms than his expected 2.2, so he goes right near the top.
In terms of Worrell versus Lloyd/Richards, there's an issue with the methodology here. If a captain helps the bowlers take more wickets (through clever field placing, say), then the bowlers' averages improve, and (by the method of this post) the team's expected results improve. This isn't such a big deal if the bowlers' careers are usually longer than the captain's reign, but it should drive the ratios towards 1 if the reign is long (as it especially is for Lloyd).
So I wouldn't draw too many conclusions, but you're well-justified in asking about Worrell.
Here's the full speadsheet on Google Docs.
*The decimal commas from when I was in France look weird to me now....
Post a Comment
Worrell's actual-to-expected ratio was 1.34*, so he'd slot in pretty high in the table, though there are others higher with a relaxed qualification on number of matches. Looking back on it, the metric is not particularly robust -- Chris Gayle had 3 wins as captain out of 20, far better in relative terms than his expected 2.2, so he goes right near the top.
In terms of Worrell versus Lloyd/Richards, there's an issue with the methodology here. If a captain helps the bowlers take more wickets (through clever field placing, say), then the bowlers' averages improve, and (by the method of this post) the team's expected results improve. This isn't such a big deal if the bowlers' careers are usually longer than the captain's reign, but it should drive the ratios towards 1 if the reign is long (as it especially is for Lloyd).
So I wouldn't draw too many conclusions, but you're well-justified in asking about Worrell.
Here's the full speadsheet on Google Docs.
*The decimal commas from when I was in France look weird to me now....
Subscribe to Post Comments [Atom]
<< Home
![]()
Subscribe to Posts [Atom]