Thursday, January 03, 2008
It's harder to make 3 than 4.
Dubaiwalla has requested a post on probabilities of getting out for certain scores. Here it is.
The overall distribution of scores (ignoring not outs) is shown below.
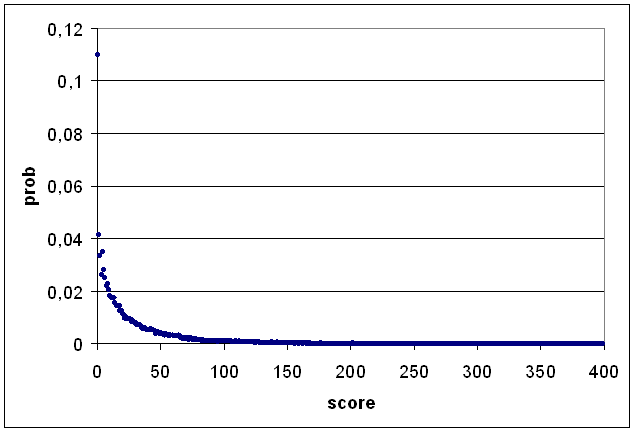
In all, there had been 7160 ducks (almost 11% of all dismissals) and 2710 scores of 1 (just over 4%) up until Christmas 2007.
The overall trend is decreasing, but there are a couple of quirks which are worth looking at. Firstly, there's the irregularities at low scores. In table form:
The frequencies decrease from 0 to 3, but there's a jump at 4 (and a smaller one at 8). We can guess that the jump at 4 is because it is quite common to hit (or edge!) a boundary early in your innings, but less likely that you're good enough to nudge a single and a 2. Interestingly, if you consider only batsmen who average at least 40, the ratio of scores of 4 to scores of 3 is almost identical. The curve is much flatter though — of these batsmen, scores of 4, 5, 6, 7, 8, and 9 are more likely than scores of 3.
It's a similar story for the mini-spike at 8. In innings for which I have boundary data, there is an average of 0,56 fours in innings when the batsman's out for 6; 0,59 when out for 7; and 0,85 when out for 8.
There are other spikes at seemingly random places (e.g., 42 is about 10% more dangerous to be on than either 41 or 43; 54 is almost 20% more dangerous than 53 or 55), presumably statistical noise. The spikes at 50 and 100 are less likely to be noise.
Charles Davis has already looked at the "nervous nineties" in his book. I should get hold of this book next week (let's hope it didn't get lost in the mail!), so I'm not yet sure exactly what he did.
What I've done is plotted a graph of the probability that you'll be dismissed in the next ten runs, given your current score.
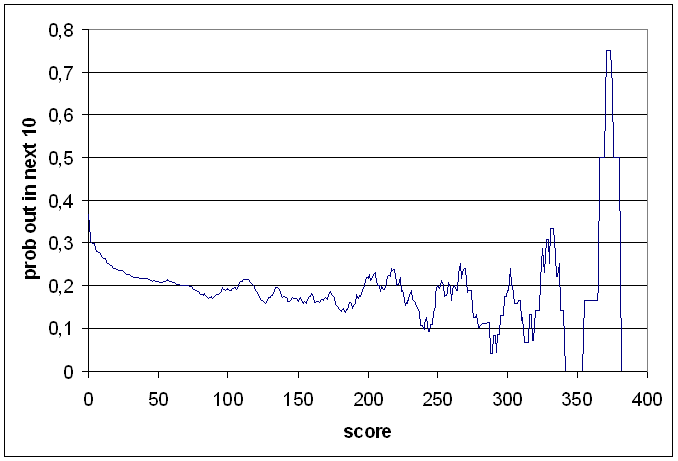
You can see a local minimum at around 90 — batsmen really do go through the nervous nineties, but because they're concentrating harder, they don't get out as often. Then, once past 100, batsmen often lose concentration and get out — the following local maximum is at 114 (agreeing with the bit of Davis's results that I have come across).
There are similar effects near 190 and 240. It is particularly pronounced on the graph at 290, but we're dealing with very little data here — there have been two dismissals in the 290's (Richards 291, Crowe 299), and four between 300 and 309 (Rowe 302, Bradman 304, Cowper 307, Sehwag 309).
There's also a minimum near 127, which is a bit weird and probably noise. There have been 23 dismissals for 136, but 37 for 137 and 31 for 138.
The overall distribution of scores (ignoring not outs) is shown below.
In all, there had been 7160 ducks (almost 11% of all dismissals) and 2710 scores of 1 (just over 4%) up until Christmas 2007.
The overall trend is decreasing, but there are a couple of quirks which are worth looking at. Firstly, there's the irregularities at low scores. In table form:
0   7160
1   2710
2   2183
3   1707
4   2281
5   1846
6   1641
7   1447
8   1497
9   1332
10  1200
The frequencies decrease from 0 to 3, but there's a jump at 4 (and a smaller one at 8). We can guess that the jump at 4 is because it is quite common to hit (or edge!) a boundary early in your innings, but less likely that you're good enough to nudge a single and a 2. Interestingly, if you consider only batsmen who average at least 40, the ratio of scores of 4 to scores of 3 is almost identical. The curve is much flatter though — of these batsmen, scores of 4, 5, 6, 7, 8, and 9 are more likely than scores of 3.
It's a similar story for the mini-spike at 8. In innings for which I have boundary data, there is an average of 0,56 fours in innings when the batsman's out for 6; 0,59 when out for 7; and 0,85 when out for 8.
There are other spikes at seemingly random places (e.g., 42 is about 10% more dangerous to be on than either 41 or 43; 54 is almost 20% more dangerous than 53 or 55), presumably statistical noise. The spikes at 50 and 100 are less likely to be noise.
Charles Davis has already looked at the "nervous nineties" in his book. I should get hold of this book next week (let's hope it didn't get lost in the mail!), so I'm not yet sure exactly what he did.
What I've done is plotted a graph of the probability that you'll be dismissed in the next ten runs, given your current score.
You can see a local minimum at around 90 — batsmen really do go through the nervous nineties, but because they're concentrating harder, they don't get out as often. Then, once past 100, batsmen often lose concentration and get out — the following local maximum is at 114 (agreeing with the bit of Davis's results that I have come across).
There are similar effects near 190 and 240. It is particularly pronounced on the graph at 290, but we're dealing with very little data here — there have been two dismissals in the 290's (Richards 291, Crowe 299), and four between 300 and 309 (Rowe 302, Bradman 304, Cowper 307, Sehwag 309).
There's also a minimum near 127, which is a bit weird and probably noise. There have been 23 dismissals for 136, but 37 for 137 and 31 for 138.
# posted by David Barry : 13:47


![]()
Subscribe to Posts [Atom]