Saturday, July 31, 2010
My database
Tests, first-class matches. Have at it.
Post any questions you have in comments, or by email. I have no idea how easy it is for someone else to make sense of what I've done.
Post any questions you have in comments, or by email. I have no idea how easy it is for someone else to make sense of what I've done.
Sunday, July 18, 2010
The co-efficient of variation
Gabriel Rogers debuted at It Figures with a post on batsmen's consistency. The main tool he used was the co-efficient of variation – the standard deviation divided by the mean. In general I think this is OK, but there is a problem with including players with short careers in the analysis.
The problem is that shorter careers might tend to have lower CV's. (I haven't checked this empirically.) To show this I'll play with exponential random variables. The distribution of a batsman's scores is reasonably close to an exponential distribution, so the results below should apply to real batsmen.
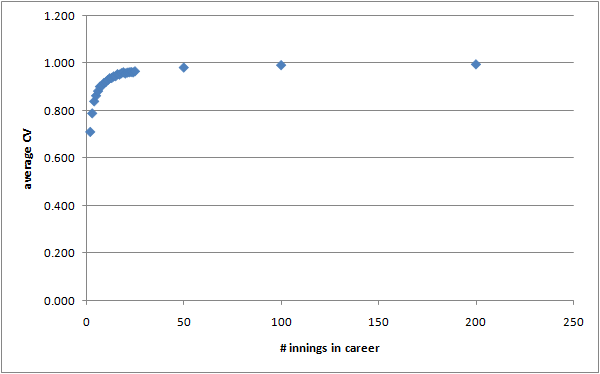
I generated 10000 "careers" of 2 innings, 10000 careers of 3 innings, 10000 careers of 4 innings, and so on. For each career length, I calculated the average CV. This is a graph of the results:

(I've used the "N-1" version of the standard deviation here.)
The theoretical CV for an exponential distribution is 1 (the standard deviation equals the mean; for real cricketers the typical CV is about 1.05, because the distribution is skewed by lots of ducks and low scores, and occasional very big scores), and you can see that for moderately large careers, this is true – the average CV for a 50-innings career is about 0.98. But for short careers the CV's are noticeably less than 1. For a two-innings career, I think the expectation of the CV is 1/sqrt(2).
My guess is that, if this effect carries over to real cricketers, then the trend shown in Figure 1 of the linked blog post is actually stronger than it looks – batsmen with shorter careers tend to be worse and have lower averages, so there'll be disproportionately many dots in the lower-left part of the scatterplot.
Of course I could check this myself, but I am pretty lazy with stats these days, as evidenced by the very long break in posting here!
The problem is that shorter careers might tend to have lower CV's. (I haven't checked this empirically.) To show this I'll play with exponential random variables. The distribution of a batsman's scores is reasonably close to an exponential distribution, so the results below should apply to real batsmen.
I generated 10000 "careers" of 2 innings, 10000 careers of 3 innings, 10000 careers of 4 innings, and so on. For each career length, I calculated the average CV. This is a graph of the results:

(I've used the "N-1" version of the standard deviation here.)
The theoretical CV for an exponential distribution is 1 (the standard deviation equals the mean; for real cricketers the typical CV is about 1.05, because the distribution is skewed by lots of ducks and low scores, and occasional very big scores), and you can see that for moderately large careers, this is true – the average CV for a 50-innings career is about 0.98. But for short careers the CV's are noticeably less than 1. For a two-innings career, I think the expectation of the CV is 1/sqrt(2).
My guess is that, if this effect carries over to real cricketers, then the trend shown in Figure 1 of the linked blog post is actually stronger than it looks – batsmen with shorter careers tend to be worse and have lower averages, so there'll be disproportionately many dots in the lower-left part of the scatterplot.
Of course I could check this myself, but I am pretty lazy with stats these days, as evidenced by the very long break in posting here!
Subscribe to Comments [Atom]